


These 22 charts and maps all told me something I found surprising. Some of them genuinely changed the way I think about the world.
Get Started for FREE
Sign up with Facebook Sign up with X
I don't have a Facebook or a X account


 Your new post is loading...
 Your new post is loading...
Your new post is loading...
These 22 charts and maps all told me something I found surprising. Some of them genuinely changed the way I think about the world. 
No comment yet.
Sign up to comment

This article is basically your guide to the most popular and an effective JavaScript toolkit for creating charts and graphs. Via Levente Nagy
Usually, Graphs and Charts are mainly used for representing and organizing a set of numerical data with a graphical representation such as pie chart, line charts, bar graphs and many more. Via Youyouk
|

20 Useful CSS Graph and Chart Tutorials and Techniques - DesignModo: pragmaticpeck:
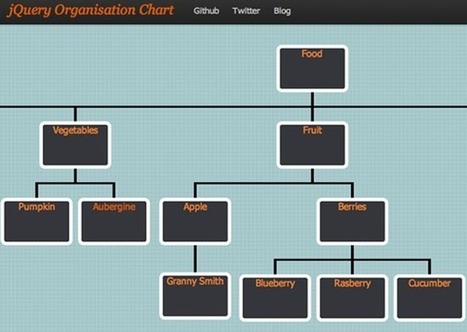
One of the overall important tasks regarding jQuery Charts involves the transformation of raw looking data into concise and interactive charts and graphs; which will not only render facts and figures within a more colorful manner- but moreover will interest readers, and furthermore simplify things for users to comprehend.
Certain JavaScript chart libraries which have been introduced as of late, have become prefered due to their rather massive range of attractive features which go on to include as many as seven types of charting with line, bar and pie being the most well known. Furthermore, some of the useful features being offered by these JS Chart Libraries are their option of zoom-in and zoom-out, while tooltips offer additional information than the general information concerning the data points and levels, as well as several options which aid in customization.
Users will also encounter certain types of jQuery charts which use a variety of HTML5 canvases which offer compatibility with modern browsers, packed with steady support from Internet Explorer. Overall, these libraries come packed with six types of charts which include points, pie, bars, lines with points, as well as the area graphs. These graphs would allow display of legends which are easily configurable and this assists within proper identification of items which are displayed on charts.
Enjoy!

From simple charts to complex maps and infographics, Brian Suda's round-up of the best – and mostly free – tools has everything you need to bring your data to life... A common question is how to get started with data visualisations. Beyond following blogs, you need to practice – and to practice, you need to understand the tools available. In this article, get introduced to 20 different tools for creating visualisations... Via Lauren Moss, Baiba Svenca

Randy Rebman's curator insight,
January 28, 2013 12:33 PM
This looks like it might be a good source for integrating infographics into the classroom. |


