Best
17.5K views | +3 today
Follow
Best
Best or Top of a Category
Your new post is loading...
Scooped by Dr. Stefan Gruenwald
Scoop.it!

Applied Data Science – Building Your Own Deep Learning System

Applied Data Science – Building Your Own Deep Learning System | Best | Scoop.it
Cutting edge data science projects.
No comment yet.
Scooped by Dr. Stefan Gruenwald
Scoop.it!

PyTorch, Dynamic Computational Graphs and Modular Deep Learning

PyTorch, Dynamic Computational Graphs and Modular Deep Learning | Best | Scoop.it

Deep Learning frameworks such as Theano, Caffe, TensorFlow, Torch, MXNet and CNTK are the work horses of Deep Learning work. These frameworks as well as the GPU (predominantly Nvidia) are the what enables the rapid growth of Deep Learning. It was refreshing to hear Nando de Freitas acknowledge their work in the recently concluded NIPS 2016 conference. Infrastructure does not get enough of the recognition it deserves in the academic community. Yet, programmers toil on to continually tweak and improve their frameworks.


Recently, a new framework was revealed by Facebook and a bunch of other partners (Twitter * NVIDIA * SalesForce * ParisTech * CMU * Digital Reasoning * INRIA * ENS). PyTorch came out of stealth development. PyTorch is an improvement over the popular Torch framework (Torch was a favorite at DeepMind until TensorFlow came along). The obvious change is the support of Python over the less often used Lua language. Almost all of the more popular frameworks use Python, so it is a relief that Torch has finally joined the club.

No comment yet.
Scooped by Dr. Stefan Gruenwald
Scoop.it!

Quantified Homescreens — What can we learn from self-tracking 40,000 iPhone homescreens?

Quantified Homescreens - Ernesto Ramirez - Medium

Betaworks recently announced that they had collected data from over 40,000 users who shared their iPhone homescreens through their apptly named #homescreen app. As they stated in their announcement, the apps people keep on their homescreen are often the apps they use the most. Being a data-minded individual I thought, “I wonder what kind of questions you could ask of this kind of data?” Of course, I immediately jumped to using the data to try and understand the landscape of self-tracking and quantified self app use. Let’s dive in.

No comment yet.
Scooped by Dr. Stefan Gruenwald
Scoop.it!

Making data come alive with Circos Plots

Making data come alive with Circos Plots | Best | Scoop.it

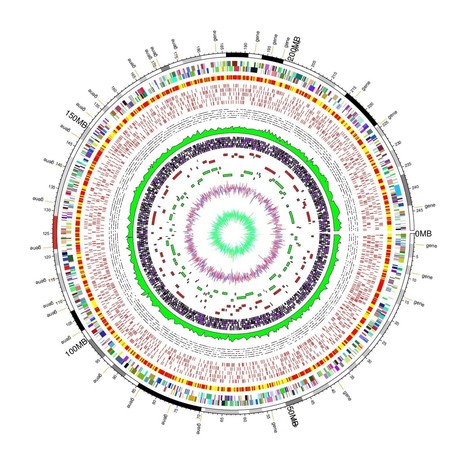
Circos plots are a great way to show genomic and other data and are famous (and infamous!) for their ability to show several different data types across dozens of chromosomes in a single plot. But it isn’t always easy to make these plots — this article covers some of your best options.

No comment yet.
Scooped by Dr. Stefan Gruenwald
Scoop.it!

How do you prove and quantify causality?

How do you prove and quantify causality? | Best | Scoop.it

What does “causality” mean, and how can you represent it mathematically? How can you encode causal assumptions, and what bearing do they have on data analysis? These types of questions are at the core of the practice of data science, but deep knowledge about them is surprisingly uncommon.


If you analyze data without regard to causality, you open your results up for the possibility of enormous biases. This includes everything from recommendation system results, to post-hoc reports on observational data, to experiments run without proper holdout groups.


Recent posts have been aimed at a more general audience. This one will be aimed at practitioners, and will assume a basic working knowledge of math and data analysis. To get the most from this post you should have a reasonable understanding of linear regression and probability (although we’ll review a lot of probability). Prior knowledge of graphical models will make some concepts more familiar, but is not required.

No comment yet.