Best
17.5K views | +0 today
Follow
Best
Best or Top of a Category
Your new post is loading...
Scooped by Dr. Stefan Gruenwald
Scoop.it!

Genomic Data Visualization in Python - From deep sequencing to insights

Genomic Data Visualization in Python - From deep sequencing to insights | Best | Scoop.it

Data comes out of the sequencer usually as fastq files which we align to the reference genome using a particular aligner (the software that will map the short reads to the reference). Once the alignment is done, two types of files can be generated, a SAM file (the alignment) and its binary version the BAM file (used in this tutorial here).


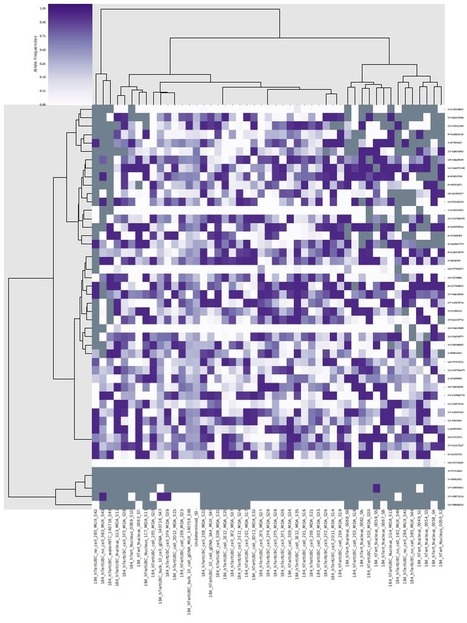
The data consist of list of bam files (one bam file per subject studied, let’s say a tissue for example), and an interval file in a bed format (listing the amplicon regions). Once these are generated, we need to visualize what we have to answer a number of questions such as:

  • what is the coverage of the sequencing
  • how are the short reads distributed across the genome ?
  • is the coverage across all amplicon regions equally distributed ?
  • in what specific amplicon region we see a lot of coverage in comparison to the others
  • can we cluster tissues per coverage ?
  • etc ..

The tutorial shows how to answer these questions and what can be done in python.


No comment yet.
Scooped by Dr. Stefan Gruenwald
Scoop.it!

7 Great Data Visualization + Business Intelligence Tools

7 Great Data Visualization + Business Intelligence Tools | Best | Scoop.it

In recent years, data and business intelligence in general has become an important part of business success. More and more business owners and teams are now relying on data more than ever before in order to make better decisions about customers, products, and systems. The problem is, data analysis doesn’t come very easy to most people. Unless you’re an experienced data scientist or a mathematician, it can be hard to interpret thousands of rows of data in a spreadsheet. Fortunately, there are a lot of great tools out there that can help make data analysis a lot easier.

No comment yet.
Rescooped by Dr. Stefan Gruenwald from Business Brainpower with the Human Touch
Scoop.it!

Top 10 Free Data Visualization Tools

Top 10 Free Data Visualization Tools | Best | Scoop.it


We all have heard the saying that “a picture is worth a thousand words,” and we use it quite often in our daily lives too, but we never get enough time to sit back and realize that it is 100 percent true.A picture actually has the ability to present an extremely complex and vast idea. A single image thus has a lot of power. Just by looking at a single image we can learn and remember so many things. Anything that is presented in a visual form is automatically more attractive and eye-catching as well as being easier to understand and learn. This Data Visualization is a trick used by many to present their boring information or data in an interesting way. The more visually attractive the data, the more attention it is going to get!


If you are trying to find some nice tools that can help you make your data visually more attractive and beautiful, then you are at the right place as today we are going to present a list of Top 10 Free Data Visualization Tools. So check them all out as all of them are truly amazing in their own ways and pick the ones you like the best!


Via The Learning Factor
The Learning Factor's curator insight, September 30, 2013 8:09 PM

A picture actually has the ability to present an extremely complex and vast idea. Here are Top 10 Free Data Visualization Tools.

Scooped by Dr. Stefan Gruenwald
Scoop.it!

Data Visualization: 20+ Useful Tools and Resources for Interactive Maps

Data Visualization: 20+ Useful Tools and Resources for Interactive Maps | Best | Scoop.it

There are plenty of cool technologies available to collect and examine data. Both web and desktop applications have provided some really great interfaces to fall in love with data mining, and with the rise in popularity we have noticed an increased number of infographics created over the past few years.

No comment yet.
Rescooped by Dr. Stefan Gruenwald from Graphics Web Design & Development News
Scoop.it!

No Photoshop? No Problem: 10 Visual Content Tools for Beginners

No Photoshop? No Problem: 10 Visual Content Tools for Beginners | Best | Scoop.it
Learn about tools you can use to design almost all of your marketing materials.

Via Brian Yanish - MarketingHits.com, donhornsby, Jakarta Web Developer
Faumuina Felolini Maria Tafuna'i's curator insight, January 15, 2015 5:00 PM

Photo editing simply. Am already using Canva and will try these others esp the infographic tool.

Alfredo Corell's curator insight, January 18, 2015 2:23 PM

Design isn't something that every marketer feels comfortable doing, but the reality is every one of us will need to design something at some point in our careers. Whether it's a website, some sales collateral, or an ebook, there will be some design expertise required to finish the project.

Nedko Aldev's curator insight, June 29, 2015 9:30 AM

add your insight...

998
Rescooped by Dr. Stefan Gruenwald from Digital Presentations in Education
Scoop.it!

The top 20 data visualisation tools

The top 20 data visualisation tools | Best | Scoop.it

From simple charts to complex maps and infographics, Brian Suda's round-up of the best – and mostly free – tools has everything you need to bring your data to life...

A common question is how to get started with data visualisations. Beyond following blogs, you need to practice – and to practice, you need to understand the tools available. In this article, get introduced to 20 different tools for creating visualisations...


Via Lauren Moss, Baiba Svenca
Randy Rebman's curator insight, January 28, 2013 12:33 PM

This looks like it might be a good source for integrating infographics into the classroom.