Cabinet de curiosités numériques
41.4K views | +0 today
Follow
Cabinet de curiosités numériques
Réalisations et projets innovants, surprenants
Curated by Audrey Bardon
Your new post is loading...
Scooped by Audrey Bardon
Scoop.it!

365data.fr

365data.fr | Cabinet de curiosités numériques | Scoop.it

Une journée, une data : Le calendrier des 365 journées mondiales en dataviz.

No comment yet.
Scooped by Audrey Bardon
Scoop.it!

A Periodic Table of Visualization Methods

A Periodic Table of Visualization Methods | Cabinet de curiosités numériques | Scoop.it
No comment yet.
Scooped by Audrey Bardon
Scoop.it!

Timelines for Transmedia

Timelines for Transmedia | Cabinet de curiosités numériques | Scoop.it
Timelines : examples just for the visual
No comment yet.
Scooped by Audrey Bardon
Scoop.it!

50 Things a Geek Should (Apparently) Know [Infographic]

50 Things a Geek Should (Apparently) Know [Infographic] | Cabinet de curiosités numériques | Scoop.it
Here is an infographic listing 50 things a geek should apparently know. The level of knowledge required to have a perfect score is a little broad, but I was
Luc Rondeleux's curator insight, September 1, 2013 11:45 AM

Why I'm not a Geek ...

Scooped by Audrey Bardon
Scoop.it!

How To Protect Yourself From Hackers | Visual.ly

How To Protect Yourself From Hackers | Visual.ly | Cabinet de curiosités numériques | Scoop.it
Hacking attacks are increasing.

To make matters worse, hackers can use many ways, from low tech methods to sophisticated techniques to steal your pri
No comment yet.
Scooped by Audrey Bardon
Scoop.it!

Infographie : Quand le cinéma imaginait la technologie du futur

Infographie : Quand le cinéma imaginait la technologie du futur | Cabinet de curiosités numériques | Scoop.it
Depuis longtemps, la science fiction imagine le futur et ses technologies incroyables. Voici une infographie signée Glow qui retrace les principales prédictions technologiques à travers…
Nath B's curator insight, July 11, 2013 4:59 AM

Des oeuvres cinématographiques qui anticipent les bouleversements technologiques et se font l'écho des préoccupations de la société... vraiment intéressant !

Scooped by Audrey Bardon
Scoop.it!

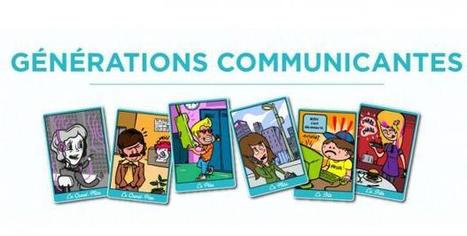
Générations communicantes

Générations communicantes | Cabinet de curiosités numériques | Scoop.it
Une petite histoire des...
http://www.inriality.fr
Nath B's curator insight, May 18, 2013 10:08 AM
Une infographie qui offre un beau panorama de l'évolution des techniques de communication.
Scooped by Audrey Bardon
Scoop.it!

Interactive Infographic with SVG and CSS Animations

Interactive Infographic with SVG and CSS Animations | Cabinet de curiosités numériques | Scoop.it
Learn how to build an interactive animated infographic using SVG, CSS and JavaScript.
No comment yet.
Scooped by Audrey Bardon
Scoop.it!

IDIKO TV | Edu. infographie

UNE RESSOURCE UNIQUE EN INFOGRAPHIE ET FRANCOPHONE! 35 capsules abordant des notions fondamentales en infographie: image matricielle, définition, résolution,...
Audrey Bardon's insight:

excellentes vidéos pédagogiques sur l' #infographie

No comment yet.
Scooped by Audrey Bardon
Scoop.it!

20 Great Infographics of 2012

20 Great Infographics of 2012 | Cabinet de curiosités numériques | Scoop.it
2012 has certainly been an eventful year, with everything from elections, to olympics, to scientific breakthroughs, to major weather events.
No comment yet.
Scooped by Audrey Bardon
Scoop.it!

How To Design Your Own Infographics

How To Design Your Own Infographics | Cabinet de curiosités numériques | Scoop.it
Infographics seem to be a real trend today, with new ones popping up daily on all sorts of subjects.
No comment yet.
Rescooped by Audrey Bardon from future school
Scoop.it!

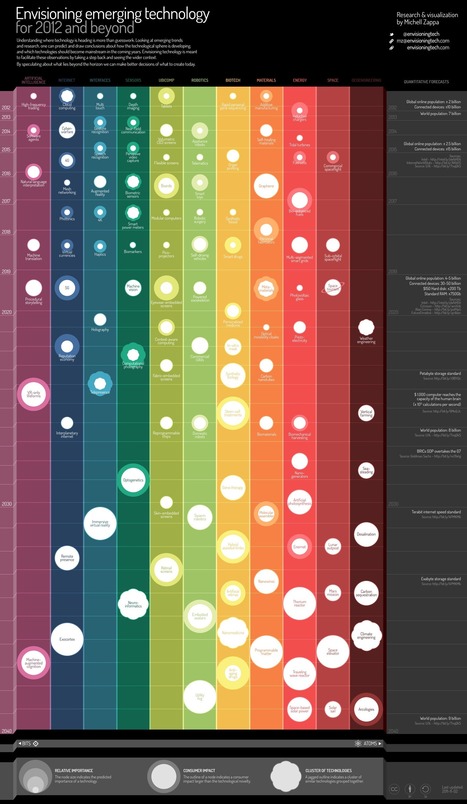
envisioningtech.png (1800x3100 pixels)

envisioningtech.png (1800x3100 pixels) | Cabinet de curiosités numériques | Scoop.it

Via Steve Wheeler
No comment yet.
Scooped by Audrey Bardon
Scoop.it!

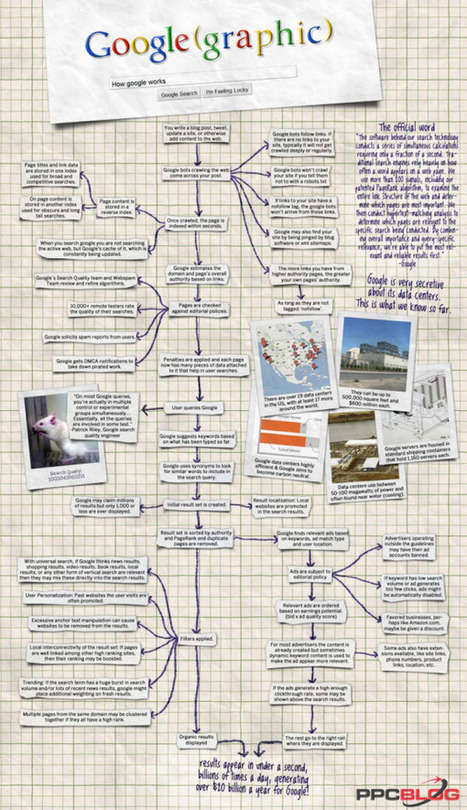
Savez-vous utiliser Google ?

Savez-vous utiliser Google ? | Cabinet de curiosités numériques | Scoop.it
Un point sur les évolutions du moteur de recherche depuis le lancement de l'interface Google Jazz en 2010.
No comment yet.
Scooped by Audrey Bardon
Scoop.it!

The Data Visualisation Catalogue

The Data Visualisation Catalogue | Cabinet de curiosités numériques | Scoop.it
The Data Visualisation Catalogue, helping you find the right data visualization method for your data
No comment yet.
Scooped by Audrey Bardon
Scoop.it!

Processing Hour of Code | Editor

#processing tutorial related with digital arts and programming.

No comment yet.
Scooped by Audrey Bardon
Scoop.it!

VisGIF Home Page

This experiment investigates the use of animated GIF to better communicate Information Visualization techniques, insights or projects. We provide you with a Google Chrome extension to quickly capture and share the image as a GIF: what can you do with it?

No comment yet.
Scooped by Audrey Bardon
Scoop.it!

IDIKO

IDIKO | Cabinet de curiosités numériques | Scoop.it
IDIKO vous propose 35 vidéos expliquant des notions fondamentales en infographie. Plus de 130 minutes de contenu vulgarisé, unique et en français.
No comment yet.
Scooped by Audrey Bardon
Scoop.it!

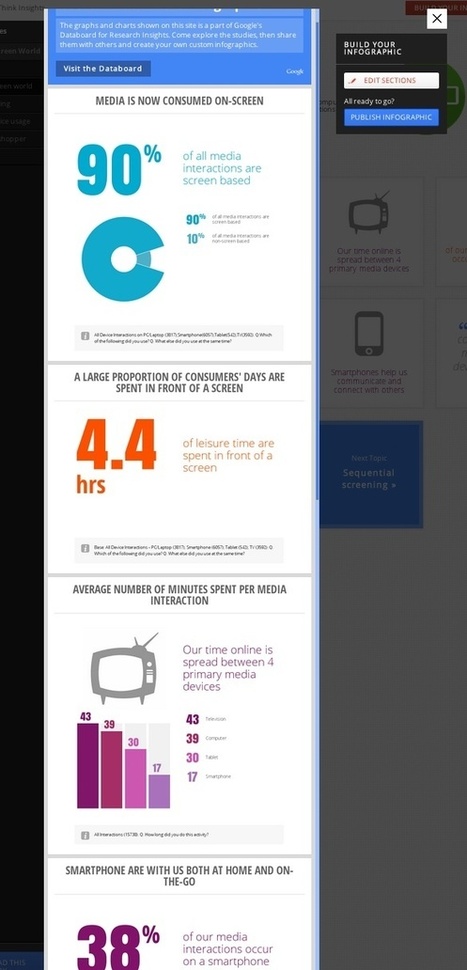
Google lance DataBoard, un nouvel outil vous permettant de créer des infographies personnalisées

Google lance DataBoard, un nouvel outil vous permettant de créer des infographies personnalisées | Cabinet de curiosités numériques | Scoop.it
Google vient de dévoiler un joli petit outil de partage des données pour les entreprises dont le but est de suivre les dernières données disponibles
Scooped by Audrey Bardon
Scoop.it!

The History of Programming Languages | Visual.ly

The History of Programming Languages | Visual.ly | Cabinet de curiosités numériques | Scoop.it
In a world of increasing inter-connectivity, programming languages form the foundation. Did you know that the first programming language is over 100 y
No comment yet.
Scooped by Audrey Bardon
Scoop.it!

Visualizing a Year’s Worth of Time

Visualizing a Year’s Worth of Time | Cabinet de curiosités numériques | Scoop.it
2013 is here, the world didn't end, and as always, time marches onward. Time really doesn't have any units that are inherent to it, but we break it up into
No comment yet.
Scooped by Audrey Bardon
Scoop.it!

20 Great Motion Graphics of 2012

20 Great Motion Graphics of 2012 | Cabinet de curiosités numériques | Scoop.it
The story of 2012 wasn't just told in static infographics. There were also a lot of motion graphics created this year, and here are 20 of the
No comment yet.
Scooped by Audrey Bardon
Scoop.it!

Infographie : les chiffres clés de la France du numérique

Infographie : les chiffres clés de la France du numérique | Cabinet de curiosités numériques | Scoop.it

Dresser le panorama de l'économie numérique en France est un défi, et pourtant cette nouvelle activité se diffuse partout. Notre infographie en résume les chiffres clés.

No comment yet.
Scooped by Audrey Bardon
Scoop.it!

What About Me?

What About Me? | Cabinet de curiosités numériques | Scoop.it

Create an infographic of your digital life and become inspired by the people you know, the things you see, and the experiences you have online.

No comment yet.
Rescooped by Audrey Bardon from Ac'tice
Scoop.it!

4 Online Infographics Generators


Let’s face it, the infographics industry is exploding and now we’re seeing some new tools to help us easily create or generate simple infographics. Currently, infographics agencies charge between $2k and $5k to research, design and promote a fantastic infographic.


The following tools, which was compiled by Douglas Karr, will make development of your infographics a lot less costly, easier to design and publish, and some include reporting modules to see how well the infographics are distributed and promoted.


Easel.ly (http://goo.gl/f5bJf) – create and share visual ideas online. You may want to visit Visual.ly after creating your infographic to publish and share it with others.


Venngage (http://goo.gl/obMee) – Venngage helps you create and publish custom infographics, engage your viewers, and track your results. Venngage is the most powerful infographics publishing platform ever for marketers and publishers


Infogram (http://goo.gl/78dZK) – We work with marvelous designers to bring you the best components and themes for your infographics. Simply pick whatever you like to build your own.


Piktochart (http://goo.gl/vPUOP) – Piktochart is among the first online web applications to autonomize the creation of infographics. Its vision is to allow non-designers/programmers to create interactive infographics to promote their cause/brand and educate in a fun and engaging manner”


Via Committed Sardine


Via 173 Sud, Frédéric DEBAILLEUL, DURET
No comment yet.