Creative teaching and learning
85.3K views | +0 today
Creative teaching and learning
New spaces for teaching, learning and supervision
Curated by Leona Ungerer
Your new post is loading...
Scooped by Leona Ungerer
Scoop.it!

Tools - Cool infographics

Tools - Cool infographics | Creative teaching and learning | Scoop.it

"Links to infographics charts and data visualization design software and web tools ..."

©

No comment yet.
Scooped by Leona Ungerer
Scoop.it!

Nineteen tools for data visualization projects

Nineteen tools for data visualization projects | Creative teaching and learning | Scoop.it

"How do you make sense of massive volumes of data? ..."

No comment yet.
Scooped by Leona Ungerer
Scoop.it!

How to make beautiful and effective infographics

How to make beautiful and effective infographics | Creative teaching and learning | Scoop.it

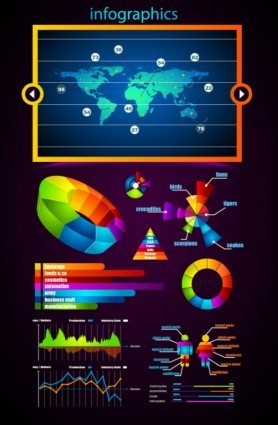
"Infographics can be a great way to convey information, but there are some key notes you need to keep in mind when looking to create your own ..."

No comment yet.
Scooped by Leona Ungerer
Scoop.it!

The digital age of data art

The digital age of data art | Creative teaching and learning | Scoop.it

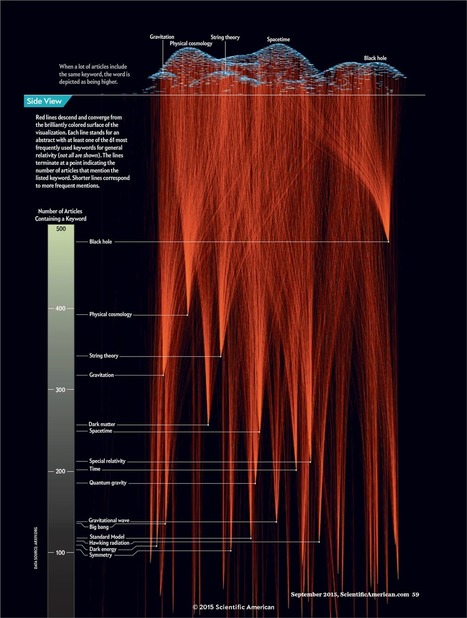
"Many artists use as material for art the raw data produced by our societies, seeking innovative means of display or transforming it into a work of art. By ..."

No comment yet.
Scooped by Leona Ungerer
Scoop.it!

The thirty-eight best tools for data visualization | Web design | Creative Bloq

The thirty-eight best tools for data visualization | Web design | Creative Bloq | Creative teaching and learning | Scoop.it

"Creating charts and infographics can be time-consuming. But these tools make it easier ..."

No comment yet.
Scooped by Leona Ungerer
Scoop.it!

[1503.00781] Teaching and learning data visualization: Ideas and assignments

[1503.00781] Teaching and learning data visualization: Ideas and assignments | Creative teaching and learning | Scoop.it

"This article discusses how to make statistical graphics a more prominent element of the undergraduate statistics curricula. The focus is on several different types of assignments that exemplify how to incorporate graphics into a course in a pedagogically meaningful way ..."

©

No comment yet.
Scooped by Leona Ungerer
Scoop.it!

e-learning, conocimiento en red: The data visualisation catalogue. Helping you display your data...

e-learning, conocimiento en red: The data visualisation catalogue. Helping you display your data... | Creative teaching and learning | Scoop.it

"e-learning, conocimiento en red y web colectiva ..."

©

No comment yet.
Suggested by April Alen Abion
Scoop.it!

What is an infographic? And how is it different from data visualization? 

What is an infographic? And how is it different from data visualization?  | Creative teaching and learning | Scoop.it

"A simple and non-technical explanation of an infographic and how it differs from other related terms such as data visualization, charts and information design ...."

No comment yet.
Scooped by Leona Ungerer
Scoop.it!

Ten types of infographics: Which one works for you?

Ten types of infographics: Which one works for you? | Creative teaching and learning | Scoop.it

"A guide to the different types of infographics and how they can be used to present your data ..."

©

No comment yet.
Scooped by Leona Ungerer
Scoop.it!

The surprising history of the infographic

The surprising history of the infographic | Creative teaching and learning | Scoop.it

"Early iterations saved soldiers' lives, debunked myths about slavery and helped Americans settle the frontier ..."

No comment yet.
Scooped by Leona Ungerer
Scoop.it!

Data visualization: 20+ useful tools and resources

Data visualization: 20+ useful tools and resources | Creative teaching and learning | Scoop.it

"There are plenty of cool technologies available to collect and examine data. Both web and desktop applications have provided some really great interfaces to ..."

No comment yet.
Scooped by Leona Ungerer
Scoop.it!

Homer meets high-Tech: Data visualization and the classics

Homer meets high-Tech: Data visualization and the classics | Creative teaching and learning | Scoop.it

"One teacher spiced up "The Iliad" with data visualization, inspiring middle school students to take a fresh look at narrative, themes, characterizations, and methods of fact-based inquiry ..."

Tracee Orman's curator insight, November 18, 2015 7:48 AM

Adding data visualization to the classics.

Rescooped by Leona Ungerer from Public Relations & Social Marketing Insight
Scoop.it!

New data viz tools and resources of 2014

New data viz tools and resources of 2014 | Creative teaching and learning | Scoop.it

"The year was filled with new data visualization and infographic creation tools, as well as other resources ..."

©


Via Jeff Domansky
Jeff Domansky's curator insight, December 21, 2014 10:45 PM

Great resource for 20 top visualization tools.

Scooped by Leona Ungerer
Scoop.it!

College students can learn valuable data visualization skills at no cost - Zawya

College students can learn valuable data visualization skills at no cost - Zawya | Creative teaching and learning | Scoop.it

"Professors around the world can integrate SAS® data visualization software into instruction, and students can learn advanced data analysis skills that are in high demand in today's job market, all at no cost. Teradata University Network (TUN) now offers SAS Visual Analytics for higher education teaching and learning..."

©

No comment yet.