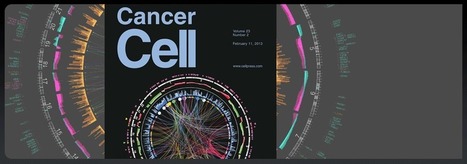
View full lesson: http://ed.ted.com/lessons/david-mccandless-the-beauty-of-data-visualization David McCandless turns complex data sets, like worldwide milita...
Marty's Take On Web Design & Data Visualization
Had an interesting conversation with Curagami ( http://www.Curagami.com ) co-founder Phil Buckley at lunch yesterday. We were discussing my attempt to change the CSS on the Hack Headphones Shopify store I'm creating.
I shared how I found a post on how to change the buy button. I wanted a bigger button. The problem was the post with the answer must have been 2 or more iterations behind the theme I'm using.
The change moved slightly unintelligible java to completely unintelligible code (at least for me). Where once there was a "height" variable now there were nested variables.
Welcome to the future of web design.
If a company with more Ph.Ds than almost anyone, Google, decides to float their index creating a responsive float that seems to wrap search results around searchers like a blanket WHY don't we lucky few Internet marketers realize that's the planet we are all in transit to?
The New Web Designer
Once a "website" becomes a series of interlocking "IF" "THEN" statements "designing" a website becomes an exercise in data visualization.
Design in a variable world is different as this great data visualization TED video shares (stay with it as the visual candy gets better in the middle). The skills need to be this "new designer" include but are not limited to:
* Spatial reasoning and intelligence.
* Ability to read and translate metrics into meaningful images (i.e. data visualization).
* Enough Javascript to choke a horse.
* Even more CSS as everything is floating in a variable galaxy.
* Understanding how variables and results should influence design, color, layout in order to increase engagement and conversion.
If this sounds like the silos between design, code, marketing, research, sales and customer service are coming down fast we agree.


 Your new post is loading...


