Didactics and Technology in Education
107.6K views | +0 today
Follow
Didactics and Technology in Education
Almost "everything" about new approaches in Education
Your new post is loading...
Rescooped by Rui Guimarães Lima from information analyst
Scoop.it!

Solving Wicked Problems: Using Systems Thinking in Design

Solving Wicked Problems: Using Systems Thinking in Design | Didactics and Technology in Education | Scoop.it

My classmates and I are in the Design for Social Innovation program because we identified problems in our communities, companies, or cultures and are keen to figure them out. But before talking about any solution or outcome, one must first frame the problem—by thoughtfully examining the system it’s part of to understand where and how to get involved.

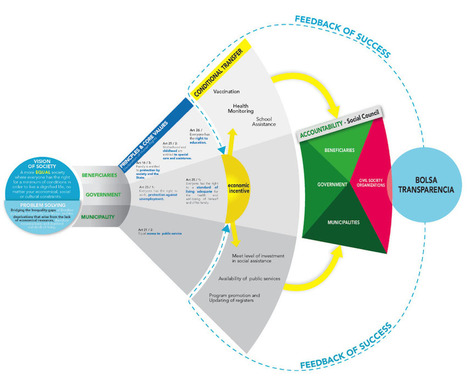
 Learning to use systems thinking, a holistic approach to problem solving that emphasizes contextual understanding, has helped me with team management, project planning, creative work, and even relationships. And for wicked problems like healthcare that confront business, nature, and society, it’s proving to be imperative.So, where to even begin? “We have to invent boundaries for clarity and sanity,” advises systems thinking pioneer Donella Meadows. Sometimes a simple infographic works to tell the story. Designing visual maps and models helps us immediately find connections and describe relationships. Creating models helps in seeing the big picture and one's place within it.


Via Lauren Moss, michel verstrepen
Martin (Marty) Smith's comment, January 28, 2013 7:14 PM
I think "design" and "programming" are rushing at each other at light speed. Web pages will be made from branching if,then,else algorithms soon. Can't just drip paint on a canvas, so design's function will be making those algorithms make visual sense.
Gordon Shupe's curator insight, February 8, 2013 6:38 AM

Info graphics don't really include digital photography, generally, but they are a fascinating way of displaying understanding, telling a story, and implying solutions.

Rescooped by Rui Guimarães Lima from Pedalogica: educación y TIC
Scoop.it!

All You Need to Know About Infographics: Tips, Tutorials, Guides

All You Need to Know About Infographics: Tips, Tutorials, Guides | Didactics and Technology in Education | Scoop.it

Let’s be honest, we don’t like to read big pieces of text. Text-heavy graphs are rather difficult for understanding, especially when dealing with numbers and statistics. That is why illustrations and flowcharts are often used for such kind of information.

An infographic, or a visual representation of study or data, like anything else, can be done right or wrong. How to create a successful infographic? A good idea and a good design.


Stop by the link for more on what defines an infographic, what contributes to its popularity, as well as the various types of infographics and references for tutorials and best practices.


Additional topics covered include:

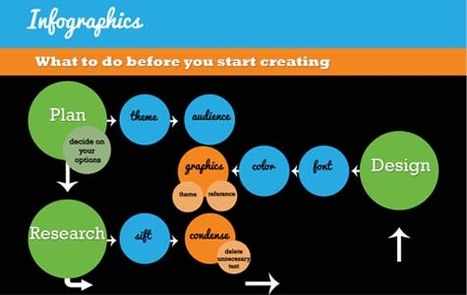
The major parts of an infographic How to create an infographic Developing ideas & organizing data Research & sources Typography, graphics & color Facts & conclusions Designing & Editing


Via Lauren Moss, Monique Walhof, THE OFFICIAL ANDREASCY, Jimi Paradise, Alazne González
HCL's curator insight, April 30, 2014 9:26 PM

Some good tips here...