Visual Design and Presentation in Education
13.1K views | +0 today
Follow
Visual Design and Presentation in Education
Tips, Tools and Tricks for Presentations, Digital and Graphic Design in Higher Education
Your new post is loading...

Popular Tags

Current selected tag: 'how-to'. Clear
Rescooped by Kim Flintoff from Curation, Social Business and Beyond
Scoop.it!

How Your Brand Colors Impact Your Audience

How Your Brand Colors Impact Your Audience | Visual Design and Presentation in Education | Scoop.it

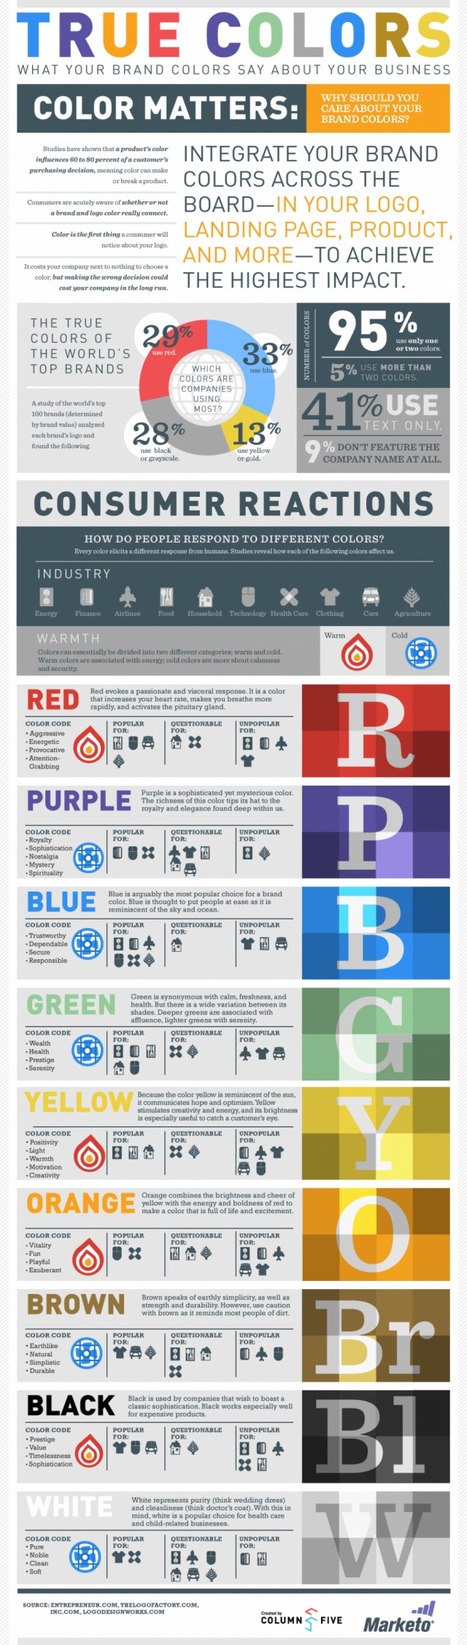
This article and infographic posted by Chelsey Kilser and Daily Infographic and is about the of findings from Entrepreneur, TheLogoFactory and Logodesignworks. 


Jan Gordon:


Effective social business requires a strong brand message,  great content and the ability to build community through deeper engagement and is first and foremost. However, the way you package your services matters and the colors you use are very important.


Excerpt:


"Colors matter and they are one of the factors that keeps your company standing out, gives your company a voice and gives you leverage over other similar companies."


Here are a few takeaways:


**The true colors of the world's top brands:


     *29% use red

     *33% use blue

     *13% use yellow

     *28% use black or grayscale


**Good information about how people respond to different colors


     Here are just a few:


      *Red is agressive, provacative, attention-

        grabbing


      *Purple signifies royalty, sophistication, mystery


      *Black means prestige, value, timelessness


      *Brown is earthlike, natural, simplistic


Selected by Jan Gordon covering "Content Curation, Social Business and Beyond"


See article and infographic here: [http://bit.ly/OjaJjM]  


Via janlgordon
No comment yet.
Rescooped by Kim Flintoff from visual data
Scoop.it!

The Process of Creating Data Visualizations

The Process of Creating Data Visualizations | Visual Design and Presentation in Education | Scoop.it
Have you ever wondered how today’s beautiful visualizations are created? If you Google ‘process of creating a data visualization’, you’d be hard-pressed to find a good resource that describes it. And maybe the reason is that there is no such process — not a formal one, anyway.

Despite not having a required set of steps, here are three stages that the visualization creation proces goes through...


Via Lauren Moss
Mariana Soffer's comment, June 27, 2012 8:31 AM
this is great