Digital Collaboration and the 21st C.
14.0K views | +0 today
Digital Collaboration and the 21st C.
Examines the connectivity possible for global knowledge participative creation and sharing.
Curated by Susan Myburgh
Your new post is loading...
Rescooped by Susan Myburgh from WHY IT MATTERS: Digital Transformation
Scoop.it!

Enterprise #DataFabric Q2 2020 @Forrester Wave highlights that data is now "virtual", generated in multiple locations but brought together in very dynamic #cloud environments

Enterprise #DataFabric Q2 2020 @Forrester Wave highlights that data is now "virtual", generated in multiple locations but brought together in very dynamic #cloud environments | Digital Collaboration and the 21st C. | Scoop.it

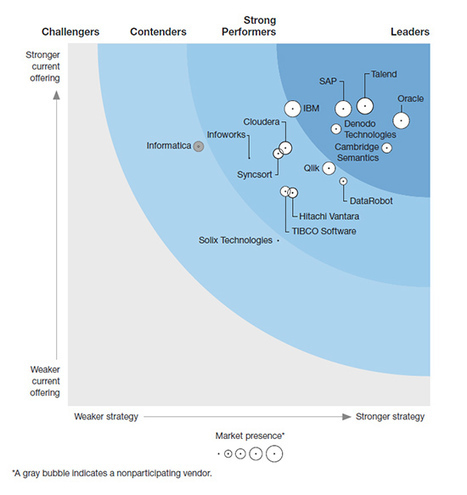
Data fabric is a hot, emerging market that delivers a unified, intelligent, and integrated end-to-end platform to support new and emerging use cases. The sweet spot is its ability to deliver use cases quickly by leveraging innovation in dynamic integration, distributed and multicloud architectures, graph engines, and distributed in-memory and persistent memory platforms. Data fabric focuses on automating the process integration, transformation, preparation, curation, security, governance, and orchestration to enable analytics and insights quickly for business success. It minimizes complexity by automating processes, workflows, and pipelines, generating code and streamlining data to accelerate various use cases such as customer 360, data science, fraud detection, internet-of-things (IoT) analytics, risk analytics, and healthcare insights.


Via Farid Mheir
Farid Mheir's curator insight, July 11, 2020 2:30 PM

WHY IT MATTERS: the net net of this report is that you should move all your data to the cloud and leverage very nimble solutions to aggregate, consolidate and massage data.

MY ALL GIFTS's curator insight, July 25, 2020 3:59 AM
Rescooped by Susan Myburgh from WHY IT MATTERS: Digital Transformation
Scoop.it!

the impact of #covid #coronavirus on #eCommerce: Top 100 Fastest Growing & Declining Categories in E-commerce #noSurprise via @umlaut21 @ChristianDion

the impact of #covid #coronavirus on #eCommerce: Top 100 Fastest Growing & Declining Categories in E-commerce #noSurprise via @umlaut21 @ChristianDion | Digital Collaboration and the 21st C. | Scoop.it

A recap of the Top 100 fastest growing & declining categories in March 2020 vs. March 2019


Via Farid Mheir
Farid Mheir's curator insight, April 6, 2020 9:52 AM

WHY IT MATTERS: eCommerce is one of the big winner of the c19 crisis. Data is starting to pour in...

Rescooped by Susan Myburgh from Web Dev, Web Design and Digital Marketing
Scoop.it!

Big Data: Insights Or Illusions?

Big Data: Insights Or Illusions? | Digital Collaboration and the 21st C. | Scoop.it
"What is Big Data? When infused with human understanding it can lead to powerful new insights. On the other hand it can be a "truth machine that you can't challenge because it's big data," cementing and intensifying the toxic assumptions in a company."

Via Jay
No comment yet.
Scooped by Susan Myburgh
Scoop.it!

Story With Data: The Ultimate Collection of Resources – @juiceanalytics

Story With Data: The Ultimate Collection of Resources – @juiceanalytics | Digital Collaboration and the 21st C. | Scoop.it
Your one stop shop for all you need to know about visual storytelling: http://t.co/ugfABM7nU4
Barney Bassnett's curator insight, April 20, 2013 2:52 AM

Yet anther great scoop from the  awesome Karen. Thanks Karen

Denyse Drummond-Dunn's curator insight, April 20, 2013 12:27 PM

The video about editing in particular is definitely worth its 9 inutes viewing time.

ozziegontang's curator insight, April 22, 2013 7:34 AM

Thanks to Zach and Team Juice for a site with insight on telling stories using data that is outa sight for all that is shared. II thank Karen Dietz of www.scoop.it/t/just-story-it for the cite. Look for her book coming out in the fall on storytelling for business.


Rescooped by Susan Myburgh from visual data
Scoop.it!

6 Illuminating Big Data Infographics

6 Illuminating Big Data Infographics | Digital Collaboration and the 21st C. | Scoop.it

Is Big Data still a big mystery to you? 

In recent years, the volume of information coming into companies has exploded, so that many IT organizations are dealing with extremely large sets of data. 

IT leaders are rethinking many aspects of how they manage and deliver information, from investments in infrastructure and analytics tools to new policies for organizing and accessing data so they can deliver more of it, faster. They are concerned that if they don't have the right tools and architectures to deal with all that information, then big data can be a big problem. Check out these infographics on Big Data to see the impact...


Via Lauren Moss
Aurélia-Claire Jaeger's curator insight, January 21, 2013 2:28 AM

Et en plus, c'est beau !

Rescooped by Susan Myburgh from 21st Century skills of critical and creative thinking
Scoop.it!

All You Need to Know About Infographics: Tips, Tutorials, Guides

All You Need to Know About Infographics: Tips, Tutorials, Guides | Digital Collaboration and the 21st C. | Scoop.it

Let’s be honest, we don’t like to read big pieces of text. Text-heavy graphs are rather difficult for understanding, especially when dealing with numbers and statistics. That is why illustrations and flowcharts are often used for such kind of information.

An infographic, or a visual representation of study or data, like anything else, can be done right or wrong. How to create a successful infographic? A good idea and a good design.


Stop by the link for more on what defines an infographic, what contributes to its popularity, as well as the various types of infographics and references for tutorials and best practices.


Additional topics covered include:

The major parts of an infographic How to create an infographic Developing ideas & organizing data Research & sources Typography, graphics & color Facts & conclusions Designing & Editing


Via Lauren Moss, Monique Walhof, THE OFFICIAL ANDREASCY, Jimi Paradise, Alazne González, Rui Guimarães Lima, Lynnette Van Dyke
HCL's curator insight, April 30, 2014 9:26 PM

Some good tips here...

Rescooped by Susan Myburgh from WHY IT MATTERS: Digital Transformation
Scoop.it!

What Does Big Tech Know About You? Basically Everything - an #infographic that should help you visualize what data is captured by the main platforms #privacy 

What Does Big Tech Know About You? Basically Everything - an #infographic that should help you visualize what data is captured by the main platforms #privacy  | Digital Collaboration and the 21st C. | Scoop.it

This infographic examines the privacy policies of Facebook, Google, Apple, Twitter, Amazon and Microsoft.


Via Farid Mheir
Farid Mheir's curator insight, June 7, 2020 9:36 AM

WHY IT MATTERS: a very interesting visualization of the data captured by the main platforms. Usually I am not a big fan of infographics but this one is different as it conveys true information. The article has a. longer form version of this.

Rescooped by Susan Myburgh from WHY IT MATTERS: Digital Transformation
Scoop.it!

The State Of IoT Intelligence - a report full of data on this new technology trend

The State Of IoT Intelligence - a report full of data on this new technology trend | Digital Collaboration and the 21st C. | Scoop.it
  • Sales, Marketing and Operations are most active early adopters of IoT today.
  • Early adopters most often initiate pilots to drive revenue and gain operational efficiencies faster than anticipated.
  • 32% of enterprises are investing in IoT, and 48% are planning to in 2019.
  • IoT early adopters lead their industries in advanced and predictive analytics adoption.

Via Farid Mheir
Farid Mheir's curator insight, November 27, 2018 1:48 PM

WHY IT MATTERS: IOT is a key technology trend but as this survey shows its penetration remains small - and thus the future looks good.

Riddhima Building's comment, December 26, 2018 6:06 AM
#RevolutionOfPreEngineeredBuildingshttps://bit.ly/2V9l3lo
Rescooped by Susan Myburgh from New Customer - Passenger Experience
Scoop.it!

#MaryMeeker's 2015 #InternetTrends report

#MaryMeeker's 2015 #InternetTrends report | Digital Collaboration and the 21st C. | Scoop.it
Print is still getting a disproportionate share of ad dollars compared with the amount of time people spend reading it, Ms. Meeker said.

Via Eric_Determined / Eric Silverstein
Roberto Fuso Nerini's curator insight, May 28, 2015 4:13 AM

2015 Internet trend. Main slides + link to the full report.

Nicolas Desachy's curator insight, May 28, 2015 8:32 AM

To be read

Stuart Walters's curator insight, May 28, 2015 11:28 AM

Mary Meeker provides great insight into Internet Trends every year, and those trends relate directly to customer expectations and Customer Experience (CX).  

Rescooped by Susan Myburgh from visual data
Scoop.it!

Is Data Visualization Art?

Is Data Visualization Art? | Digital Collaboration and the 21st C. | Scoop.it

Data Visualization is driven by data. Its form is often derived from optimizing the efficiency of inputting data (and information about that data) into a human brain. It is a very pragmatic practice, built around numbers and logic.


And yet it is beautiful. It evokes emotions. It can be aesthetically pleasing, or hideous. It communicates complex concepts and provokes thought. It is consumed for enjoyment. Some visualizations even share similarities with poetry.

There are several stages in the life cycle of data visualizations, and while the core of the practice is driven by rational thinking, any number of stages in the process have opportunities for subjective decisions or artistic interpretations...


Via Lauren Moss
Lauren Moss's curator insight, January 24, 2013 7:42 PM

An overview of the creative and artistic processes involved in data visualization...

Rescooped by Susan Myburgh from visual data
Scoop.it!

40 must-see vídeos about data visualization and infographics

40 must-see vídeos about data visualization and infographics | Digital Collaboration and the 21st C. | Scoop.it

Visual Loop's selection of keynotes, TED Talks, and interviews by some of the top names in the field:


From Visualoop.com:

After the success of our collection of data visualization presentations a few weeks ago, we decided to push even further our research of multimedia resources and take the risk of selecting some videos. And we say risk, because the abundance of data visualization videos on the Internet is simply mind-blowing. Just think about it: How many events are there about information visualization? Dozens, maybe hundreds every year. Then, add the documentaries, interviews and educational videos, and soon you’ll realize, like we did, that this list could easily be up to one hundred or more. That means that a lot of good stuff was left behind, so apologies for that – but feel free to leave your recommendations in the comments section. Also, please note that some of these videos are over one hour long.
Via Lauren Moss
No comment yet.