

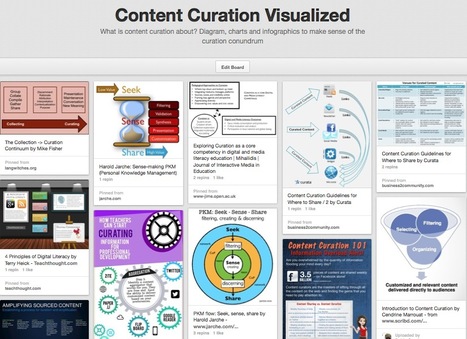
What is content curation about? Diagram, charts and infographics to make sense of the curation conundrum
Via Robin Good
Get Started for FREE
Sign up with Facebook Sign up with X
I don't have a Facebook or a X account


 Your new post is loading...
 Your new post is loading...
Your new post is loading...
What is content curation about? Diagram, charts and infographics to make sense of the curation conundrum Via Robin Good 
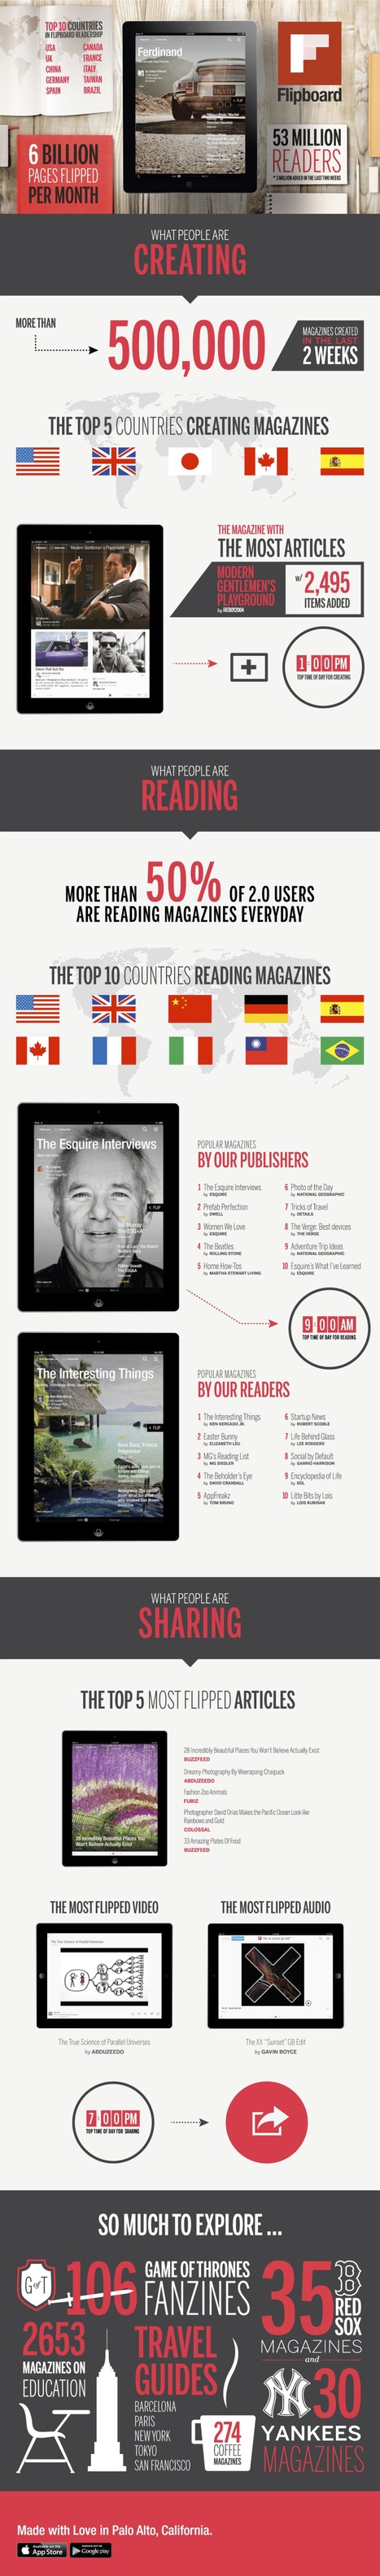
Flipboard is a personal magazine made up of the things you care about most. Recently, it surpassed 50 million readers and released a new feature that allows users to create their own magazines. Readers can now collect and curate the web pages they like into these magazines on Flipboard.
Since the new edition of Flipboard was announced several weeks ago, an additional 3 million readers have joined (for a total of 53 million currently). Also, more than 500,000 magazines have been created since too, given this great new way to curate content for mobile devices. In fact, there are over 6 billion pages flipped per month! More than 50% of Flipboard 2.0 users are reading magazines every day. 9am is the top time of the day for reading, while 7pm is the peak time for sharing. Some of the most popular magazines by publishers include The Esquire Interviews (by Esquire), Prefab Perfection (by Dwell), Women We Love (by Esquire), and The Beatles (by Rolling Stone). Using Flipboard is a truly an amazing experience and the site could be looking at exponential growth in the years to come as mobile devices completely take over! Via Jeff Domansky

Jeff Domansky's curator insight,
April 14, 2013 1:53 PM
The awesome Flipboard app is showcased in this infographic. 
Constance Jones Collier's curator insight,
July 17, 2013 8:51 PM
compelling reason to for content curation it brands you .
![5 Reasons We Use Social Media [Infographic] | Digital Collaboration and the 21st C. | Scoop.it](https://img.scoop.it/0dX8Ctv2ZvgMgSGXFog8zzl72eJkfbmt4t8yenImKBVvK0kTmF0xjctABnaLJIm9)
There are many reasons we use social media. From the basic to the more advanced, the tool is simply ubiquitous and addictive. This infographic sheds some light for us all. Via Gust MEES

Latisha Poulard's curator insight,
March 21, 2013 10:46 PM
You see why if you don't have an online presence then you are part of a dying breed...
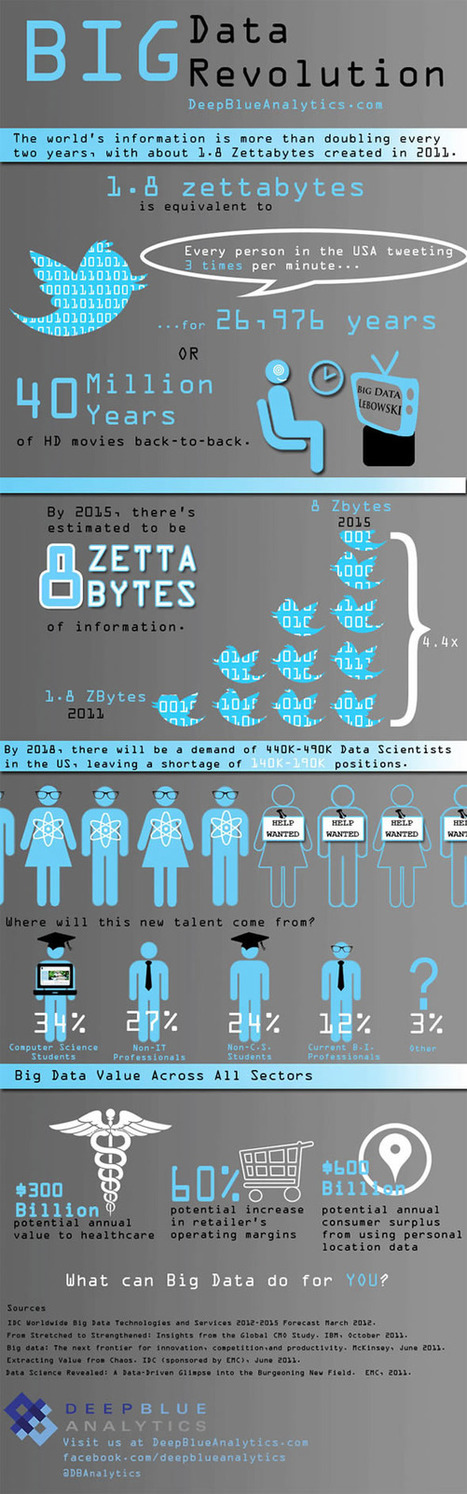
Is Big Data still a big mystery to you? Via Lauren Moss

From
ht

Let’s be honest, we don’t like to read big pieces of text. Text-heavy graphs are rather difficult for understanding, especially when dealing with numbers and statistics. That is why illustrations and flowcharts are often used for such kind of information. An infographic, or a visual representation of study or data, like anything else, can be done right or wrong. How to create a successful infographic? A good idea and a good design.
Stop by the link for more on what defines an infographic, what contributes to its popularity, as well as the various types of infographics and references for tutorials and best practices.
Additional topics covered include: The major parts of an infographic How to create an infographic Developing ideas & organizing data Research & sources Typography, graphics & color Facts & conclusions Designing & Editing Via Lauren Moss, Monique Walhof, THE OFFICIAL ANDREASCY, Jimi Paradise, Alazne González, Rui Guimarães Lima, Lynnette Van Dyke
|

Like all new technology, social media changes fast. Just trying to keep your head around all of the different platforms, how to approach them and, of course, how to design for them can be a full time job. Social media has proven itself as a crucial component of a brand’s marketing mix, but with the many different platforms, it can be very difficult to put forth a consistent brand image online. The [Ridiculously Exhausitive] Social Media Design Blueprint features all of the major design dimensions for all of the major platforms, including Facebook, Twitter, Google+, LinkedIN, YouTube, Pinterest and the most recent entry, Instagram. Via Lauren Moss

Two Pens's curator insight,
May 30, 2013 1:31 PM
How to keep up with all those pesky design requirements on FB,LI, Twitter, etc. Thank you, somebody! 
MESODEV's curator insight,
May 31, 2013 4:01 AM
Voilà une infographie utile plutôt que de rechercher sans cesse les bonnes dimensions ! 
Therese Matthys's curator insight,
June 6, 2013 10:05 AM
Is your company consistent with its brand image online across all channels?
![Smartphone and Mobile App Usage [Infographic] | Digital Collaboration and the 21st C. | Scoop.it](https://img.scoop.it/Lbqdh59xpIMVchKdJRHwkDl72eJkfbmt4t8yenImKBVvK0kTmF0xjctABnaLJIm9)
The Smartphone App Usage showcases the smartphone user behavior. This infographic will also take you through the world of mobile applications and provide you with rich insights and statistics on the popular app categories and mobile games. Via Gust MEES

Jacqui Sharp's curator insight,
March 15, 2013 4:30 PM
Clear, well laid out infographic with statistics and recognisable graphics and icons. Lots of great information. Would cause a lot of discussion in a classroom. 
James J. Goldsmith's comment,
March 18, 2013 7:17 PM
Does what a good infographic should do - provides a lot of useful information in an aesthetically pleasing way that can be quickly understood.
Visual Loop's selection of keynotes, TED Talks, and interviews by some of the top names in the field:
From Visualoop.com: After the success of our collection of data visualization presentations a few weeks ago, we decided to push even further our research of multimedia resources and take the risk of selecting some videos. And we say risk, because the abundance of data visualization videos on the Internet is simply mind-blowing. Just think about it: How many events are there about information visualization? Dozens, maybe hundreds every year. Then, add the documentaries, interviews and educational videos, and soon you’ll realize, like we did, that this list could easily be up to one hundred or more. That means that a lot of good stuff was left behind, so apologies for that – but feel free to leave your recommendations in the comments section. Also, please note that some of these videos are over one hour long.Via Lauren Moss
|


![Workplace Personality Types & How They Support Each Other [Infographic] | Digital Collaboration and the 21st C. | Scoop.it](https://img.scoop.it/eCgfIu5YbqpKIIcUjn3FdTl72eJkfbmt4t8yenImKBVvK0kTmF0xjctABnaLJIm9)


Curate using this visual map
This will be helpful to share to those wondering about content curation.
Valuable collection of the art of curation from Robin Good.