Digital Collaboration and the 21st C.
14.0K views | +0 today
Follow
Digital Collaboration and the 21st C.
Examines the connectivity possible for global knowledge participative creation and sharing.
Curated by Susan Myburgh
Your new post is loading...
Rescooped by Susan Myburgh from visualizing social media
Scoop.it!

The Journey of a Tweet: Infographic

The Journey of a Tweet: Infographic | Digital Collaboration and the 21st C. | Scoop.it

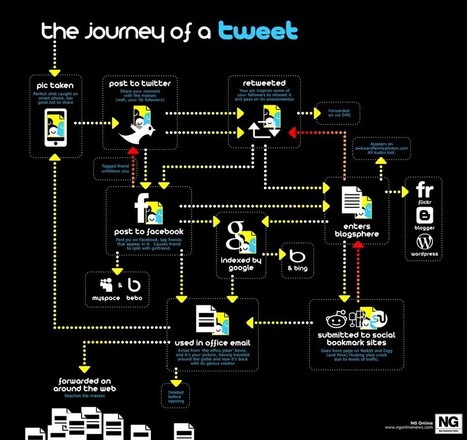
Twitter is a cultural phenomenon that has changed the way we communicate around the world. This infographic shows the literal journey of a tweet - from the initial tweet to the retweet and beyond.


This graph shows that a single tweet can cross social media channels in mere seconds. In this age of quick technology, people are getting information at such a rapid rate that it’s hard to keep up at times...

Check out the infographic for more interesting facts.


Via Lauren Moss
Maria Persson's curator insight, May 16, 2013 1:01 AM

Look closely...where do your tweets go in your 'professional circles'?

Joe Wise's curator insight, May 16, 2013 5:32 PM

Always wondered what the .....

Rescooped by Susan Myburgh from 21st Century skills of critical and creative thinking
Scoop.it!

All You Need to Know About Infographics: Tips, Tutorials, Guides

All You Need to Know About Infographics: Tips, Tutorials, Guides | Digital Collaboration and the 21st C. | Scoop.it

Let’s be honest, we don’t like to read big pieces of text. Text-heavy graphs are rather difficult for understanding, especially when dealing with numbers and statistics. That is why illustrations and flowcharts are often used for such kind of information.

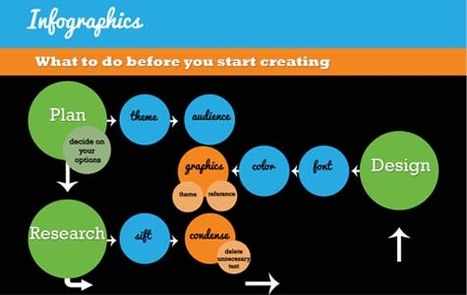
An infographic, or a visual representation of study or data, like anything else, can be done right or wrong. How to create a successful infographic? A good idea and a good design.


Stop by the link for more on what defines an infographic, what contributes to its popularity, as well as the various types of infographics and references for tutorials and best practices.


Additional topics covered include:

The major parts of an infographic How to create an infographic Developing ideas & organizing data Research & sources Typography, graphics & color Facts & conclusions Designing & Editing


Via Lauren Moss, Monique Walhof, THE OFFICIAL ANDREASCY, Jimi Paradise, Alazne González, Rui Guimarães Lima, Lynnette Van Dyke
HCL's curator insight, April 30, 2014 9:26 PM

Some good tips here...

Rescooped by Susan Myburgh from visual data
Scoop.it!

Is Data Visualization Art?

Is Data Visualization Art? | Digital Collaboration and the 21st C. | Scoop.it

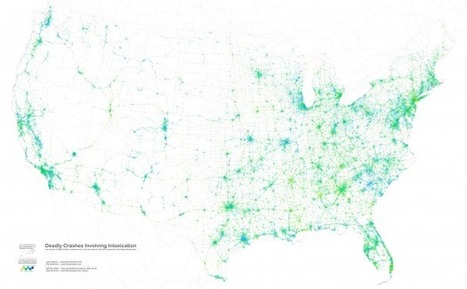
Data Visualization is driven by data. Its form is often derived from optimizing the efficiency of inputting data (and information about that data) into a human brain. It is a very pragmatic practice, built around numbers and logic.


And yet it is beautiful. It evokes emotions. It can be aesthetically pleasing, or hideous. It communicates complex concepts and provokes thought. It is consumed for enjoyment. Some visualizations even share similarities with poetry.

There are several stages in the life cycle of data visualizations, and while the core of the practice is driven by rational thinking, any number of stages in the process have opportunities for subjective decisions or artistic interpretations...


Via Lauren Moss
Lauren Moss's curator insight, January 24, 2013 7:42 PM

An overview of the creative and artistic processes involved in data visualization...