Digital Collaboration and the 21st C.
14.0K views | +0 today
Follow
Digital Collaboration and the 21st C.
Examines the connectivity possible for global knowledge participative creation and sharing.
Curated by Susan Myburgh
Your new post is loading...
Rescooped by Susan Myburgh from visual data
Scoop.it!

6 Illuminating Big Data Infographics

6 Illuminating Big Data Infographics | Digital Collaboration and the 21st C. | Scoop.it

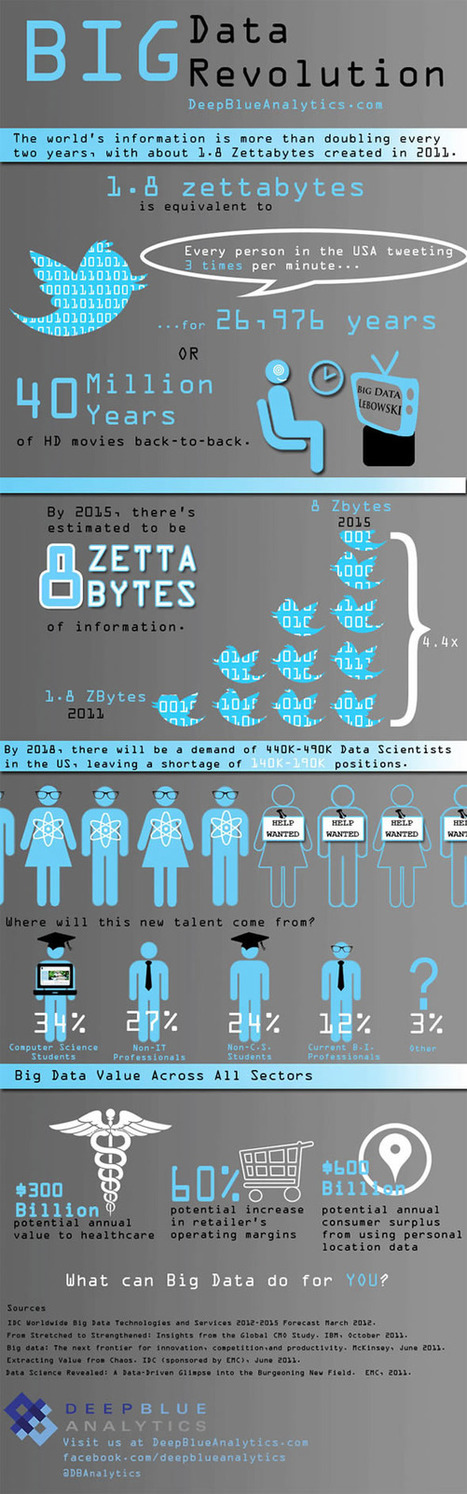
Is Big Data still a big mystery to you? 

In recent years, the volume of information coming into companies has exploded, so that many IT organizations are dealing with extremely large sets of data. 

IT leaders are rethinking many aspects of how they manage and deliver information, from investments in infrastructure and analytics tools to new policies for organizing and accessing data so they can deliver more of it, faster. They are concerned that if they don't have the right tools and architectures to deal with all that information, then big data can be a big problem. Check out these infographics on Big Data to see the impact...


Via Lauren Moss
Aurélia-Claire Jaeger's curator insight, January 21, 2013 2:28 AM

Et en plus, c'est beau !

Rescooped by Susan Myburgh from 21st Century skills of critical and creative thinking
Scoop.it!

All You Need to Know About Infographics: Tips, Tutorials, Guides

All You Need to Know About Infographics: Tips, Tutorials, Guides | Digital Collaboration and the 21st C. | Scoop.it

Let’s be honest, we don’t like to read big pieces of text. Text-heavy graphs are rather difficult for understanding, especially when dealing with numbers and statistics. That is why illustrations and flowcharts are often used for such kind of information.

An infographic, or a visual representation of study or data, like anything else, can be done right or wrong. How to create a successful infographic? A good idea and a good design.


Stop by the link for more on what defines an infographic, what contributes to its popularity, as well as the various types of infographics and references for tutorials and best practices.


Additional topics covered include:

The major parts of an infographic How to create an infographic Developing ideas & organizing data Research & sources Typography, graphics & color Facts & conclusions Designing & Editing


Via Lauren Moss, Monique Walhof, THE OFFICIAL ANDREASCY, Jimi Paradise, Alazne González, Rui Guimarães Lima, Lynnette Van Dyke
HCL's curator insight, April 30, 2014 9:26 PM

Some good tips here...

Rescooped by Susan Myburgh from visual data
Scoop.it!

40 must-see vídeos about data visualization and infographics

40 must-see vídeos about data visualization and infographics | Digital Collaboration and the 21st C. | Scoop.it

Visual Loop's selection of keynotes, TED Talks, and interviews by some of the top names in the field:


From Visualoop.com:

After the success of our collection of data visualization presentations a few weeks ago, we decided to push even further our research of multimedia resources and take the risk of selecting some videos. And we say risk, because the abundance of data visualization videos on the Internet is simply mind-blowing. Just think about it: How many events are there about information visualization? Dozens, maybe hundreds every year. Then, add the documentaries, interviews and educational videos, and soon you’ll realize, like we did, that this list could easily be up to one hundred or more. That means that a lot of good stuff was left behind, so apologies for that – but feel free to leave your recommendations in the comments section. Also, please note that some of these videos are over one hour long.
Via Lauren Moss
No comment yet.