


Earlier this month Quizlet , a popular flashcard service, added a new interactive diagram feature. This new feature can be used b
Via Tom D'Amico (@TDOttawa)
Get Started for FREE
Sign up with Facebook Sign up with X
I don't have a Facebook or a X account


 Your new post is loading...
 Your new post is loading...
Your new post is loading...
Earlier this month Quizlet , a popular flashcard service, added a new interactive diagram feature. This new feature can be used b Via Tom D'Amico (@TDOttawa) 
No comment yet.
Sign up to comment

When you've got projects to manage, events to plan and the never-ending demands of life hovering over your head, it's helpful to get your thoughts onto paper. Do you carry around a pen and pad? Maybe not; but if you're like most people, your mobile device is always within arm's reach. Plan and organize your… Via Luísa Lima

"Through the Free Technology for Teachers Facebook page I recently received a request for some suggested online chart creation tools..." Via Baiba Svenca

Gust MEES's curator insight,
February 11, 2015 11:13 AM
Lucidchart is an easy tool to use to create flowcharts, mindmaps, and graphic organizers. Lucidchart offers a simple drag and drop interface for creating flow charts, organizational charts, mind maps, and other types of diagrams. To create with Lucidchart just select elements from the menus and drag them to the canvas. You can re-size any element and type text within elements on your chart. Arrows and connecting lines can be re-sized, repositioned, and labeled to bring clarity to your diagrams. Find out more tools by visiting the article... |
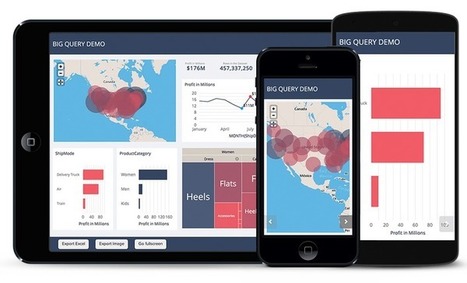
You don’t need to be a seasoned data scientist or have a degree in graphic design in order to create incredible data visualisations. Via Baiba Svenca

DocBiodiv's curator insight,
March 16, 2015 4:01 AM
Ca donne envie d'essayer : nuage de mots, graphiques, cartes... Par Christopher Ratcliff @ Econsultancy publié le 25/02 
Fenia's curator insight,
March 16, 2015 4:55 AM
Check out how to add visualisations to your presentations.
"Through the Free Technology for Teachers Facebook page I recently received a request for some suggested online chart creation tools..." Via Baiba Svenca, aufaitLibrarian
Gust MEES's curator insight,
February 11, 2015 11:13 AM
Lucidchart is an easy tool to use to create flowcharts, mindmaps, and graphic organizers. Lucidchart offers a simple drag and drop interface for creating flow charts, organizational charts, mind maps, and other types of diagrams. To create with Lucidchart just select elements from the menus and drag them to the canvas. You can re-size any element and type text within elements on your chart. Arrows and connecting lines can be re-sized, repositioned, and labeled to bring clarity to your diagrams. Find out more tools by visiting the article...
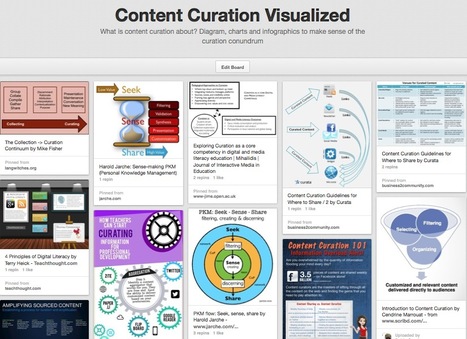
What is content curation about? Diagram, charts and infographics to make sense of the curation conundrum Via Robin Good, Helena Afonso Dos Santos

Monica S Mcfeeters's curator insight,
March 30, 2014 9:18 AM
This will be helpful to share to those wondering about content curation. 
Jeff Domansky's curator insight,
September 1, 2014 11:53 PM
Valuable collection of the art of curation from Robin Good. |


