

In our final post of Infographics Week, a history teacher tells how she used the Gulf oil spill to have students create infographics about the worst disasters in American history.
Get Started for FREE
Sign up with Facebook Sign up with X
I don't have a Facebook or a X account


 Your new post is loading...
 Your new post is loading...
Your new post is loading...
In our final post of Infographics Week, a history teacher tells how she used the Gulf oil spill to have students create infographics about the worst disasters in American history.
Beth Dichter's insight:
Have you thought about having students create infographics and held back because you were not sure how to go about doing this type of project? This post provides an in-depth look at one teacher does this type of project. A step-by-step list of what to do is included as well as the three essential questions that students were to address. Although designed for a high school class the step-by-step directions are easy to modify to meet the needs of your students. This was one of a series of posts published by the NY Times. At the end of the post there are links to four additional posts in this series on Teaching With Infographics: Places to Start; Social Studies, History, Economics; Science and Health; and Language Arts, Fine Arts, and Entertainment. 
From
www

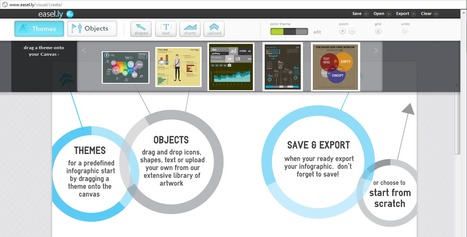
Create infographics online...easel.ly defines itself as "a theme-based web-app for creating infographics and data visualization." easel.ly is in beta and provides drag and drop pre-designed themes (currently five choices) and the ability to customize objects (as in people, animals, backgrounds, maps and more), creating rich infographics. easel.ly supports Firefox, Chrome and Safari.
|
Who knew? Infogr.am, a tool that allows you to create infographics, now allows you to include videos in your infographics...with the caveat they must come from YouTube or Vimeo. For more information check out this post from Richard Byrne!
|


Infographics is a new kind of visual literacy. They are a kind of visual summary of information that would take a reader hours to process
This was a great project for our teachers last year. We are posting their info graphics outside out Office of Professional Development.
Been loving infographics and looking for a good way to incorporate these. Hoping for an app that would make them easily. We'll see what this has to say...