Eclectic Technology
224.6K views | +3 today
Follow
Eclectic Technology
Tech tools that assist all students to be independent learners & teachers to become better teachers
Curated by Beth Dichter
Your new post is loading...
Scooped by Beth Dichter
Scoop.it!

Two Great Classroom Posters on The Six Thinking Hats

Two Great Classroom Posters on The Six Thinking Hats | Eclectic Technology | Scoop.it
Beth Dichter's insight:

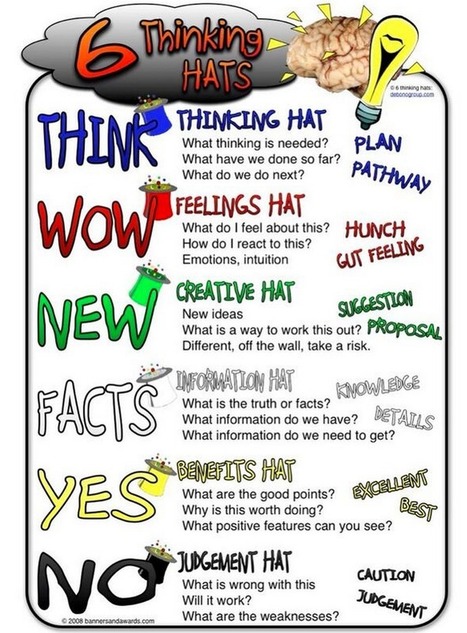
Here is another way to have students think about their thinking. The Six Hats was written by Edward de Bono, and provides one way for students to organize their "thinking and decision making skills."
Each had is a different color and each represents a different way you might approach thinking.

* The white hat is about data and information. Think of it as a neutral position.

* The red hat looks at emotions.

* The yellow hat had a positive point of view.

* The black hat is more cautious.

* The green hat is for creative thinking and new ideas.

* The blue hat is for thinking about thinking (metacognition).

The post includes two additional visuals. Many students might find the process of thinking about what hat they would wear to help them determine the best way to approach specific areas.

Charmaine Thaner's curator insight, July 19, 2014 12:49 AM

I think IEP meetings could be more productive if the 6 Thinking Hats approach was used.  What do you think?

Julie Lindsay's curator insight, July 20, 2014 6:47 PM

A fresh take on the Thinking Hats - a great tool for writing blog reflections and other individual as well as collaborative work.

Scooped by Beth Dichter
Scoop.it!

25 Facts You Should Know About Your Gray Matter | Online Universities

25 Facts You Should Know About Your Gray Matter | Online Universities | Eclectic Technology | Scoop.it
Read on to learn some fascinating facts about your brain that might just motivate you to give it the respect it deserves.
No comment yet.
Scooped by Beth Dichter
Scoop.it!

40 Maps That Will Help You Make Sense of the World

40 Maps That Will Help You Make Sense of the World | Eclectic Technology | Scoop.it
  If you're a visual learner like myself, then you know maps, charts and infographics can really help bring data and information to life. Maps can make a point resonate with readers and this c...
Beth Dichter's insight:

Maps are great visuals for teaching about concepts of space (as in spatial intelligence) and data. This collection of forty maps is diverse and you will find quite a few that you may want to share with students but check them out first. Based on the grade level you teach there may be maps you will not share. Luckily there are links to where the map was first found. A few of the maps are listed below. The one in the image is a "Map of 'Pangea' with Current International Borders."

* Countries that do not use the Metric System

* The Only 22 Countries in the World that Britain has not Invaded

* Map of Time Zones in Antarctica

* Global Internet Usage Based on Time of Day

* World Map of Earthquakes since 1898

* The 7000 Rivers that Feed the Mississippi River

Olivier Aidyn's curator insight, August 16, 2013 12:44 AM

good work dude

Olivier Aidyn's comment, August 16, 2013 9:10 AM
Such a great infographics !
mtmeme's curator insight, August 16, 2013 10:31 AM

These are amazing!

Scooped by Beth Dichter
Scoop.it!

The Collapse of Public Education in America | Online Universities

The Collapse of Public Education in America | Online Universities | Eclectic Technology | Scoop.it

An infographic that looks at The Collapse of Public Education in America.

No comment yet.