Eclectic Technology
224.6K views | +3 today
Follow
Eclectic Technology
Tech tools that assist all students to be independent learners & teachers to become better teachers
Curated by Beth Dichter
Your new post is loading...
Scooped by Beth Dichter
Scoop.it!

Words, Pictures, Numbers, WOW! – 2nd Grade Infographics Attract Attention

Words, Pictures, Numbers, WOW! – 2nd Grade Infographics Attract Attention | Eclectic Technology | Scoop.it

"For the past four years, we’ve been using infographics with our students at different grade levels. This year, our second graders were studying New York City to make comparisons between its historical past at the turn of the last century with today. Instead of the typical presentation poster, they made infographics using the Easelly app."

Beth Dichter's insight:

Can 2nd graders create infographics? Based on this post from ASIDE the answer would be yes! The students were able to Easel.ly and create 8 infographics that show their understanding of New York City at the turn of the century and today. Consider trying a similar project with students in your classroom (and make sure to learn to use Easel.ly before you introduce it to your students!).

No comment yet.
Scooped by Beth Dichter
Scoop.it!

Canva - Create Beautiful Slides, Posters, and Infographics

Canva - Create Beautiful Slides, Posters, and Infographics | Eclectic Technology | Scoop.it

"Canva is a new service that makes it easy to create beautiful slides, flyers, posters, infographics, and photo collages. Creating these graphics on Canva is a drag-and-drop process. Start by selecting a template then dragging and dropping into place background designs, pictures, clip art, and text boxes."

Beth Dichter's insight:

Canva is in beta but their response for an account is usually done within 3 or 4 days. Create slides, flyers, posters, infographics and more and download them or link to the online graphic. You may upload your own images or use from their collection. This looks like a quick and easy way for you or your students to create media for classes or activities that take place in your school.

No comment yet.
Scooped by Beth Dichter
Scoop.it!

Alphablocks - 26 Strategies to Improve your Learning (Visual)

Alphablocks - 26 Strategies to Improve your Learning (Visual) | Eclectic Technology | Scoop.it
Beth Dichter's insight:

How about starting a New Year by sharing learning strategies? Here is an infographic that provides 26 learning strategies. Consider sharing one a day for the next 26 days, or print out a copy and share it with your students. A few of the ideas included are:

* Connect the Dots

* Hypothesize, Test, Adjust

* Listen More

* Question Assumptions

Scooped by Beth Dichter
Scoop.it!

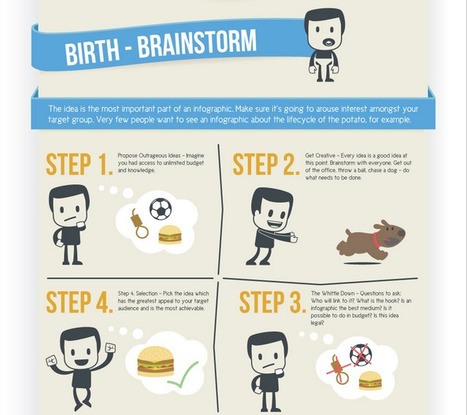
The Life Cycle of An Infographic

The Life Cycle of An Infographic | Eclectic Technology | Scoop.it

Have you ever wondered what about the life cycle of an infographic? Here is one view from Birth - Brainstorm to Infancy - Research to Adolescence - Design to Adulthood - Promotion to Death or Resurrection. 

No comment yet.