


 Your new post is loading...

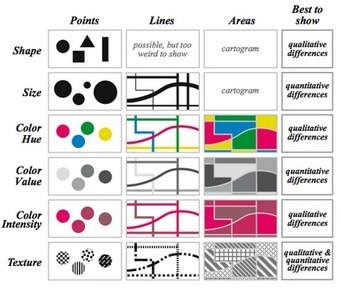

"Whether they realize it or not, our students are inundated with numbers. It can be hard for them to get a handle on the competing streams of information from tech and social media. One way they can learn to negotiate this "Age of Big Data" is by becoming familiar with the different types of charts and displays..."
Providing simple tools and suggestions of sites with resources this post explores the taxonomy of graphs and ways to guide students on how to look at graphs.


