


 Your new post is loading...

From
visual
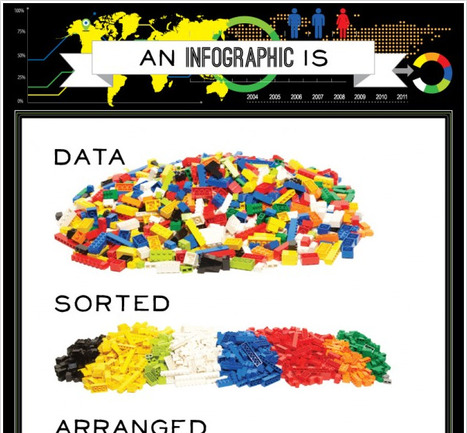
"This is an infographic about what is an infographic. Using Lego blocks and photography we wanted to show that.a good infographic is simple and require and requires little text."


This infographic is great for showing how basic an infographic may be, and to help students understand what goes into creating a graph. The four key concepts, collecting data, sorting data, arranging data and presenting the data visually (so others may understand it) are true when students learn how to make graphs...and most students have played with Legos at some point so there is a quick connection. To see the full infographic click through to Visual.ly.