This post begins with a quote from President Obama:
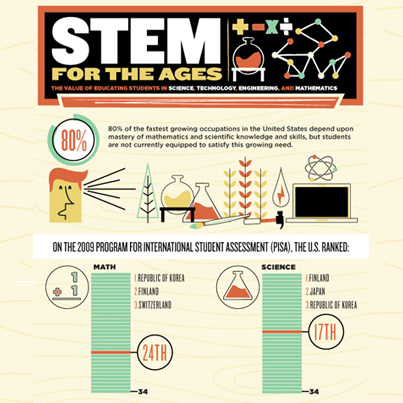
"“The quality of math and science teachers is the most important single factor influencing whether students will succeed or fail in science, technology, engineering and math.” From this point it veers in a different direction, noting that the issue is that teachers "are not given the freedom to support children in ways that will produce the scientists and innovators our country needs."
If we look to our past (and our present) we will find that we are not listening to the advice that "our nation's historic inventors, scientists, and physicists (whom have shared) their advice and experiences."
Read the article to learn the experiences of Albert Einstein, Thomas Edison, Richard Feyman, Michio Kaku (which includes a video where he explains "that exams are crushing curiousity out of the next generation..."), as well as individuals around today such as Aaron Iba and Jack Andraka (the student who at the age of 15 created a test for pancreatic cancer).
Perhaps the question we need to ask is how do we change the system to support the necessary learning?


 Your new post is loading...


This video may change the way you view the sun. For the last five years NASA's Solar Dynamics Observatory (SDO) has been taking images of the sun and this video provides views that are breath taking. I have shown this video to students from kindergarten through grade 7 and all want to see it again. There are amazing images with music, and very few words. Try to find five minutes in your day to watch this, and chances are you will find yourself forwarding the link to others.
Quoting from NASA "Watch the movie to see giant clouds of solar material hurled out into space, the dance of giant loops hovering in the corona, and huge sunspots growing and shrinking on the sun's surface."