Rescooped by Dennis Swender from Presentation Tools |
Get Started for FREE
Sign up with Facebook Sign up with X
I don't have a Facebook or a X account
Your new post is loading...
Alex's curator insight,
August 1, 2016 10:45 PM
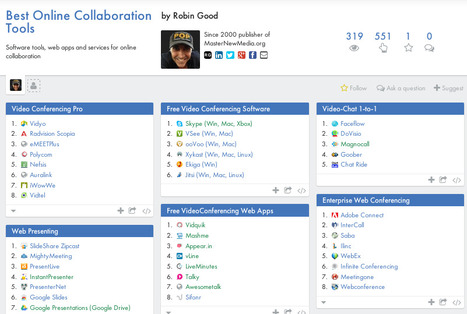
Wow! That's a whole lotta tools.....
Sign up to comment
Ana Sanchez's curator insight,
April 29, 2014 4:51 PM
A very nice summary of all the points you need to think about when preparing a conference presentation. "Because “imagine everyone's naked” is terrible advice."
Alex's curator insight,
August 1, 2016 10:51 PM
great point on reacting and reflecting after your presentations to improve for future :)
Lea Marucci's curator insight,
October 27, 2017 10:30 PM
Inquiry Session 3: Delivering Presentations
Moses B. Tambason's curator insight,
November 15, 2013 10:21 PM
Watch this video to help the special needs in Africa this thanks giving holiday http://www.africatube.net/video/932/Neglected-people-of-Africa-need-your-help
Gianfranco Marini's curator insight,
November 17, 2013 1:21 PM
Da http://www.journalism.co.uk 9 strumenti web based per lo storytelling. Si tratta di strumenti che consentono di realizzare storie visuali con elementi multimediali e interattivi.
Utili per la content curation e per realizzare presentazioni.
Possono essere utilizzati senza problemi nelal didattica per realizzare raccolte e/o narrazioni di eventi e/o problemi di carattere disciplinare e interdisciplinare. |
Ana Sanchez's curator insight,
April 29, 2014 4:51 PM
A very nice summary of all the points you need to think about when preparing a conference presentation. "Because “imagine everyone's naked” is terrible advice."
Alex's curator insight,
August 1, 2016 10:51 PM
great point on reacting and reflecting after your presentations to improve for future :)
Lea Marucci's curator insight,
October 27, 2017 10:30 PM
Inquiry Session 3: Delivering Presentations
Robin Good's curator insight,
February 2, 2014 5:47 AM
The Data Visualisation Catalogue is an on-going project developed by Severino Ribecca which attempts to index and catalogue all of the data visualization approaches available, in order to help journalists, designers and professional communicators identify more easily the type of data visualization most appropriate for their needs. . In the Catalogue there are now over 50 different data visualization approaches that have been identified, and about a third of them have also been documented with a basic description, visual examples, relevant tags to associate it with their possibe best uses, variations, and with a list of alternative tools available to create that type of data chart. . You can browse the catalogue also by using the "Search by Function" which is designed to aid in choosing the appropiate data visualization approach based on the specific communication need at hand, or with the "View by List" approach, which organizes dataviz methods by types. . My comment: Excellent resource for visual communicators of all kinds as it helps you see the great variety of dataviz approaches available. It makes it easier to identify and select relevant solutions according to needs and use. . Check it out: http://blog.visual.ly/the-data-visualization-catalogue/ . . Hat Tip to @LelioSimi
Una Sinnott's curator insight,
February 2, 2014 4:54 PM
A great collection of data visualisation tools, categorised by the characteristics of the data you want to show.
Juliana Elisa Raffaghelli's curator insight,
February 19, 2014 7:14 AM
Rappresentare: raccontare la realtà in modo tale da attrarre in modo efficace l'attenzione del nostro interlocutore/lettore. In una società iperconnessa e dialogica, fondamentale competenza.
Moses B. Tambason's curator insight,
November 15, 2013 10:21 PM
Watch this video to help the special needs in Africa this thanks giving holiday http://www.africatube.net/video/932/Neglected-people-of-Africa-need-your-help
Gianfranco Marini's curator insight,
November 17, 2013 1:21 PM
Da http://www.journalism.co.uk 9 strumenti web based per lo storytelling. Si tratta di strumenti che consentono di realizzare storie visuali con elementi multimediali e interattivi.
Utili per la content curation e per realizzare presentazioni.
Possono essere utilizzati senza problemi nelal didattica per realizzare raccolte e/o narrazioni di eventi e/o problemi di carattere disciplinare e interdisciplinare. |