ED 262 Research, Reference & Resource Skills
2.1K views | +0 today
Follow
ED 262 Research, Reference & Resource Skills
View related curated articles on Flipboard / Research & Resource Skills at http://flip.it/mWcVKd  
Curated by Dennis Swender
Your new post is loading...
Rescooped by Dennis Swender from visual data
Scoop.it!

Data Visualization 101: Scatter Plots

Data Visualization 101: Scatter Plots | ED 262 Research, Reference & Resource Skills | Scoop.it

In our Data Visualization 101 series, we cover each chart type to help you sharpen your data visualization skills.Scatter plots have been called the “most versatile, polymorphic, and generally useful invention in the history of statistical graphics” (Journal of the History of the Behavioral Sciences, 2005).

That’s a big claim, but just as their name implies, they can take a confusing and scattered set of data and make sense of it. As such, these plots are much more than a visualization tool; they are a discovery tool. Let’s look at what makes the scatter plot so good...


Via Lauren Moss
Marco Favero's curator insight, June 19, 2015 3:49 AM

aggiungi la tua intuizione ...

Christopher Higgins's curator insight, July 18, 2015 6:17 AM

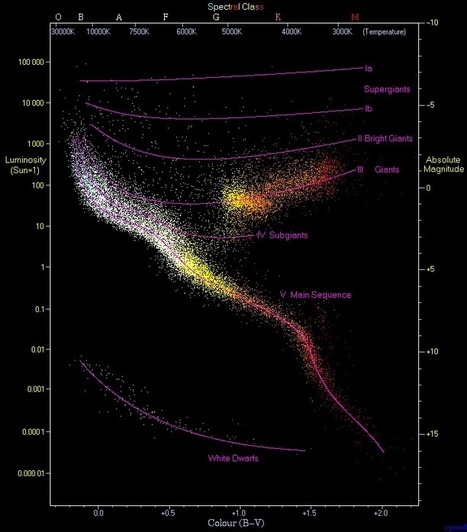
A quick history of graphing information and how scatter plots are unique from other ways of graphing in more than one way.  A great visual of the different types of relationships that are easily identified on a scatter plot, highlighting why scatter plots are so useful to understand relationships between two different variables.  

Rescooped by Dennis Swender from visual data
Scoop.it!

City Layouts Created with OpenStreetMap Data

City Layouts Created with OpenStreetMap Data | ED 262 Research, Reference & Resource Skills | Scoop.it

Topography, architecture and traffic routes give every city a unique structure.
'These conditions create the typical and individual inner structure of a city. I didn’t only want to show these structures in the conventional way from above, but also including the exact three-dimensionality of topography and buildings – a real world visualisation.
The OpenStreetMap data enabled me to visualize the satellite-based information using DEM Earth in Cinema 4D. The results are some extraordinary views of large capitals and small towns.'


Via Lauren Moss
No comment yet.