EdTech Tools
43.1K views | +1 today
Follow
EdTech Tools
primarily for ABE/GED/ESOL teachers, but useful for anyone wanting to integrate technology
Curated by Patty Ball
Your new post is loading...
Scooped by Patty Ball
Scoop.it!

How To Find Openly Licensed Educational Resources You Can Use [Infographic]

How To Find Openly Licensed Educational Resources You Can Use [Infographic] | EdTech Tools | Scoop.it
Most of us turn to the internet when we are looking for resources to use for a presentation, report or article. The internet holds the key to so many robust resources.

Yet how many of these resources can you legally use for free? How many of them can you adapt?

That’s where Open Educational Resources (OER) can help. Here’s an infographic from the Center for Open Educational Resources and Language Learning (at the University of Texas at Austin) that can help.
Suzanne's curator insight, February 17, 2015 5:02 AM

Every language teacher and student should contribute to make this a powerful resource concept. Language is an instrument; use it, take care of it, share it.

Dean Mantz's curator insight, February 18, 2015 11:15 AM

Thanks to @Dennis T OConnor for sharing this infographic on finding and identifying open source education resources.  

Iolanda Bueno de Camargo Cortelazzo's curator insight, February 19, 2015 12:00 PM

Bastante úteis estas informações para professores e gestores educacionais.

Scooped by Patty Ball
Scoop.it!

Piktochart's Infographic App - Education pricing plan

Piktochart's Infographic App - Education pricing plan | EdTech Tools | Scoop.it
Piktochart's DIY Infographic App - Special Discount Pricing Plan for Education.
No comment yet.
Scooped by Patty Ball
Scoop.it!

12 Data visualizations that illustrate poverty's biggest challenges

Want to learn more about the issues surrounding poverty in the world today? We ve assembled a collection of some of the best data visualizations for just that.
Patty Ball's insight:

some good infographics and visualizations

No comment yet.
Scooped by Patty Ball
Scoop.it!

Moovly - Create Animated Content like a Pro

Moovly - Create Animated Content like a Pro | EdTech Tools | Scoop.it
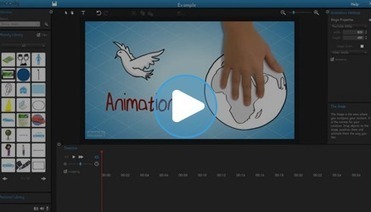
Moovly is an online tool that allows you to create animated videos, tutorials, explainers, presentations, infographics, video clips, display ads or e-cards.
No comment yet.
Scooped by Patty Ball
Scoop.it!

Infographics in Education - Piktochart blog

Infographics in Education - Piktochart blog | EdTech Tools | Scoop.it
Infographics in education. We asked teachers to share their opinions and experiences on infographics in classroom, as well as examples of their projects.
No comment yet.
Scooped by Patty Ball
Scoop.it!

e-Learning Infographics Submit for Free your Education Infographic | e-Learning Infographics

e-Learning Infographics Submit for Free your Education Infographic | e-Learning Infographics | EdTech Tools | Scoop.it
Submit for Free your Education Infographic on e-Learning Infographics to promote it! A broad social media campaign will follow!
No comment yet.
Scooped by Patty Ball
Scoop.it!

Infographics for Librarians, Educators, and Other Cool Geeks - LiveBinder

Infographics: Links to blogs, creation tools, and cool infographs.
Patty Ball's insight:

livebinder full of infographics for educators

No comment yet.
Scooped by Patty Ball
Scoop.it!

Infographic of the Day: Who Drives Worse, Teens, or Seniors?

Infographic of the Day: Who Drives Worse, Teens, or Seniors? | EdTech Tools | Scoop.it
Teens--but not by much.
No comment yet.
Scooped by Patty Ball
Scoop.it!

Creating your first infographic.

Creating your first infographic. | EdTech Tools | Scoop.it
Patty Ball's insight:

create animated infographics

No comment yet.
Scooped by Patty Ball
Scoop.it!

Nik's QuickShout: Exploiting Infographics for ELT

Nik's QuickShout: Exploiting Infographics for ELT | EdTech Tools | Scoop.it
Patty Ball's insight:

great ideas on using infographics in language learning classes - useful for all types of classes

Scoopingaddress's curator insight, September 8, 2013 12:10 PM

Visuals often provide EFL-ESL learners with more appealing lessons : illustrating them with infographics brings information and gets learners to understand more easily, as well... everyone's eyes are pleased -not only visual learners' :-)

Rescooped by Patty Ball from 21st Century Learning and Teaching
Scoop.it!

How Do We Measure a Competency?

How Do We Measure a Competency? | EdTech Tools | Scoop.it
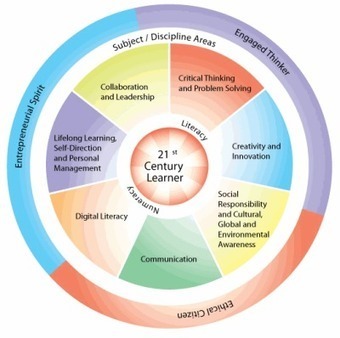
Recently, I participated in two excellent Twitter chats on the #21stedchat hashtag. The first was about Assessing 21st Century Competencies and the second explored Marks and Grades in the 21st Cent...

Via Gust MEES
Gust MEES's curator insight, January 23, 2013 10:26 AM

A MUST read!


Louise Robinson-Lay's curator insight, January 25, 2013 5:27 PM

21 st century learning skills.

Scooped by Patty Ball
Scoop.it!

Infographics Science: The Surprising Way The Brain Processes Visuals

Infographics Science: The Surprising Way The Brain Processes Visuals | EdTech Tools | Scoop.it
Based on how the brain deciphers complex visual information, designers can understand the scientific basis behind best the practices for infographics.
No comment yet.
Scooped by Patty Ball
Scoop.it!

321 Free Tools for Teachers - Free Educational Technology - eLearning Industry

321 Free Tools for Teachers - Free Educational Technology - eLearning Industry | EdTech Tools | Scoop.it
At this article you will find 321 Free Educational Technology Tools for teachers, online educators, instructors and eLearning professionals.
No comment yet.
Scooped by Patty Ball
Scoop.it!

Create infographics & online charts | infogr.am

Create infographics & online charts | infogr.am | EdTech Tools | Scoop.it
Create infographics and interactive online charts. It's free and super-easy!
No comment yet.
Scooped by Patty Ball
Scoop.it!

Infographics - Jun: Resource: Sample Infographic for Remix

Sloan-C workshops are the smart way to support continuous professional development. Each workshop is developed by practitioners for practitioners; enabling thousands of colleagues worldwide to collaborate cost effectively with peers and experts, via real-time and asynchronous meetings.
Learn More and Register
No comment yet.
Scooped by Patty Ball
Scoop.it!

17 Eye-popping Infographics on e-Learning and Online Education – Online University Data

17 Eye-popping Infographics on e-Learning and Online Education – Online University Data | EdTech Tools | Scoop.it
No comment yet.
Rescooped by Patty Ball from Tools for Teachers & Learners
Scoop.it!

Create Interactive Online Presentations, infographics, animations & banners

Create Interactive Online Presentations, infographics, animations & banners | EdTech Tools | Scoop.it

Easily Create online Presentations, animations, animated HTML5 banners, infographics and other rich visual content free in your browser.


Via Nik Peachey
Daniel Compton's curator insight, June 14, 2014 12:37 PM

Another PowerPoint alternative

Sergei Polovin's curator insight, June 17, 2014 11:32 AM

Great tool!

johanna krijnsen's curator insight, June 23, 2014 4:02 AM

another great tool for students to create online presentations and animations

Scooped by Patty Ball
Scoop.it!

Data Visualized: More on Teaching With Infographics

Data Visualized: More on Teaching With Infographics | EdTech Tools | Scoop.it
New resources for our growing collection on teaching with infographics.
No comment yet.
Scooped by Patty Ball
Scoop.it!

9 Powerful Free Infographic Tools To Create Your Own Infographics - DATA VISUALIZATION

9 Powerful Free Infographic Tools To Create Your Own Infographics - DATA VISUALIZATION | EdTech Tools | Scoop.it
Create infographics, free tools for data visualization and analysis including charts, data visualisation tools, icon archives and more infographics software to start creating your own infographics.
No comment yet.
Scooped by Patty Ball
Scoop.it!

Infographic Graphics | Interactive Charts | Piktochart Infographics

Infographic Graphics | Interactive Charts | Piktochart Infographics | EdTech Tools | Scoop.it
Piktochart is the easiest way to generate your own infographic graphics. Check out this renowned info graphic app's product features here.
No comment yet.