Design, Science and Technology
45.7K views | +0 today
Follow
Design, Science and Technology
#ideas #design #science #technology #inspiration #media #information
Your new post is loading...
Rescooped by Antonios Bouris from Web Dev, Web Design and Digital Marketing
Scoop.it!

Is Your Company’s Data Actually Valuable in the AI Era?

Is Your Company’s Data Actually Valuable in the AI Era? | Design, Science and Technology | Scoop.it

"AI is coming. That is what we heard throughout 2017 and will likely continue to hear throughout this year. For established businesses that are not Google or Facebook, a natural question to ask is: What have we got that is going to allow us to survive this transition?"


Via Jay
No comment yet.
Rescooped by Antonios Bouris from visual data
Scoop.it!

2014: The Year Big Data Adoption Goes Mainstream In The Enterprise

2014: The Year Big Data Adoption Goes Mainstream In The Enterprise | Design, Science and Technology | Scoop.it
Last week IDG published their latest big data enterprise survey and predictions for 2014 finding that on average, enterprises will spend $8M on big data –related initiatives in 2014.

The study also found that 70% of enterprise organizations have either deployed or are planning to deploy big data-related projects and programs.  The study 2014 IDG Enterprise Big Data Research is summarized here.  The goal of the study includes gaining a better understanding of organizations’ big data initiatives, investments and strategies.


Via Lauren Moss
No comment yet.
Rescooped by Antonios Bouris from visual data
Scoop.it!

Big Data Techniques for Analyzing Large Data Sets – Infographic

Big Data Techniques for Analyzing Large Data Sets – Infographic | Design, Science and Technology | Scoop.it

Until the emergence of “Big Data”, data were mainly treated locally in warehouses of several structured databases. Gradually, these data sources became diversified.


Analysts are projecting the future of customer data. Several points of attention are highlighted. While most companies collect, store and analyze data, majority of them are struggling with their big project data and are struggling to meet IT challenges associated with the use of this framework.


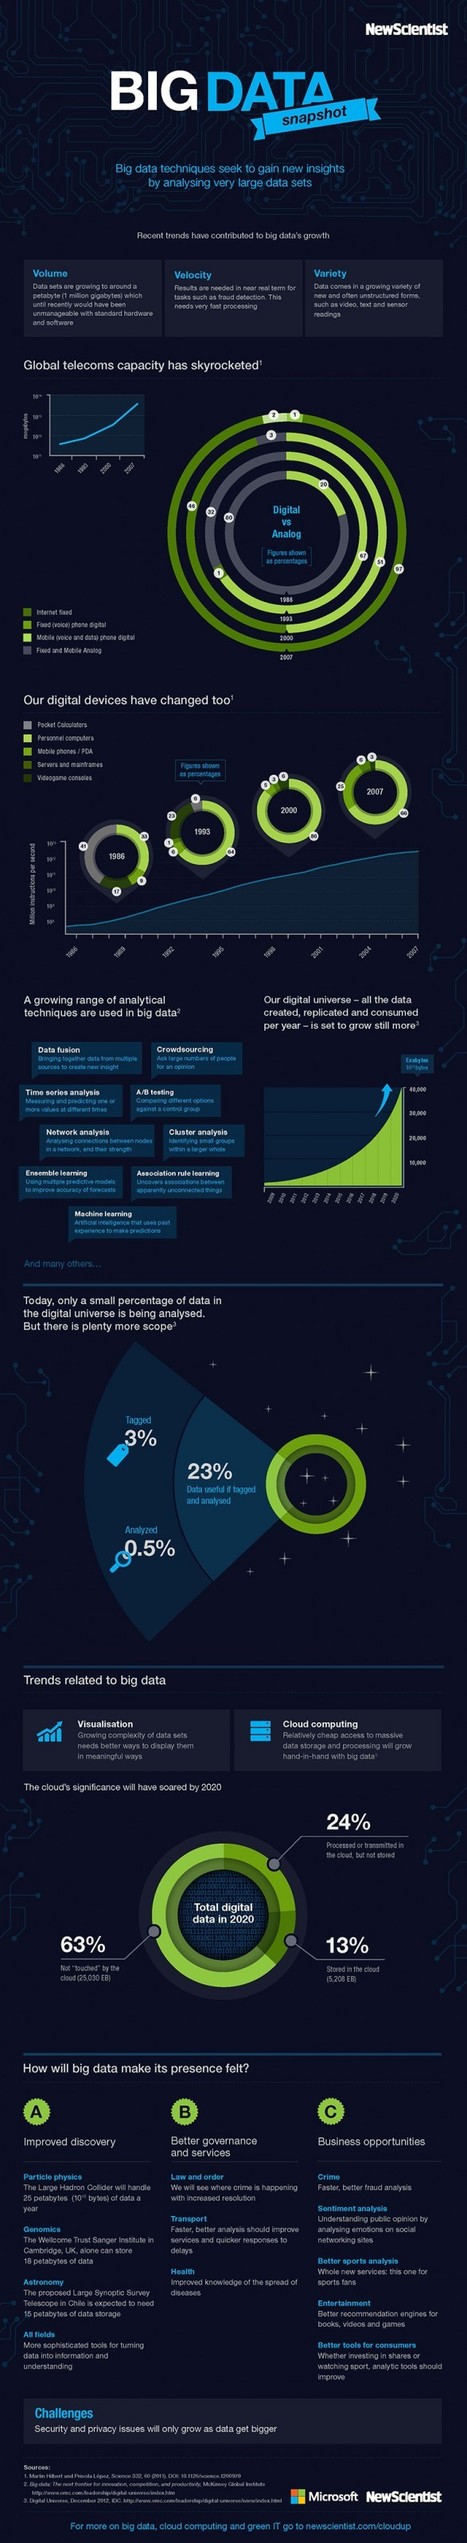
Newscientis, with Microsoft, released an infographic on how big data techniques seek to gain insight by analyzing large data sets. The proliferation of sources associated with 3V (volume, variety, velocity) have contributed to big data’s recent growth. Data is coming in a growing variety of new and often unstructured forms such as text, video and sensor reading.

By 2020, all the digital data created, replicated and consumed per year will reach 40,000 Exabytes. The connected devices including pocket calculators, personnel computer, mobile phones, servers and mainframes and videogame consoles have contributed more than 10 million instructions per second.


Via Lauren Moss
No comment yet.
Rescooped by Antonios Bouris from visual data
Scoop.it!

How to Tell a Powerful Story with Data Visualization

How to Tell a Powerful Story with Data Visualization | Design, Science and Technology | Scoop.it

In the age of Big Data, folks are often overwhelmed by the volume of data sources, charts, and graphs thrown at them every day. Enter data visualization – the ability to condense, analyze, and share data that makes an impact. Throughout history, data visualization has been used to document everything from health crises to the effect of colors on mood.

But what exactly does data visualization do and how can you leverage it to grow your business? Are data visualization and infographics the same thing? Read on to learn more, plus discover some fascinating examples.


Via Lauren Moss
Chris Biddy's curator insight, October 28, 2014 4:30 PM

Very insightful look at the what, how and so what of data visualization. Another example of how a good visualization makes data digestible!

Marco Favero's curator insight, October 28, 2014 4:52 PM

aggiungi la tua intuizione ...

Rescooped by Antonios Bouris from visual data
Scoop.it!

Using Big Data to Ask Big Questions

Using Big Data to Ask Big Questions | Design, Science and Technology | Scoop.it

Big Questions are speculative, exploratory, and systemic. As the name implies, they are also answered at scale: Rather than distilling a small slice of a dataset into a concrete answer, Big Questions look at entire datasets and reveal small questions you wouldn’t have thought to ask...


Via Lauren Moss
Ignasi Alcalde's comment, December 25, 2013 5:23 AM
awesome