Your new post is loading...
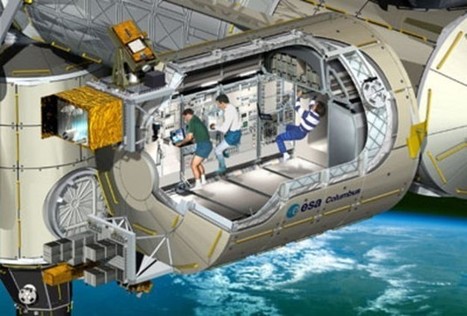
The very idea of a moon city ignites a constellation of questions about what it would look like and how we would build it. So CityLab called Woerner to find out. With the International Space Station potentially coming offline around 2024, he says, it’s time to envision the next era of human presence beyond Earth. The moon-city project would be a prime driver of technological advancement as well as basic scientific research.
Via Lauren Moss
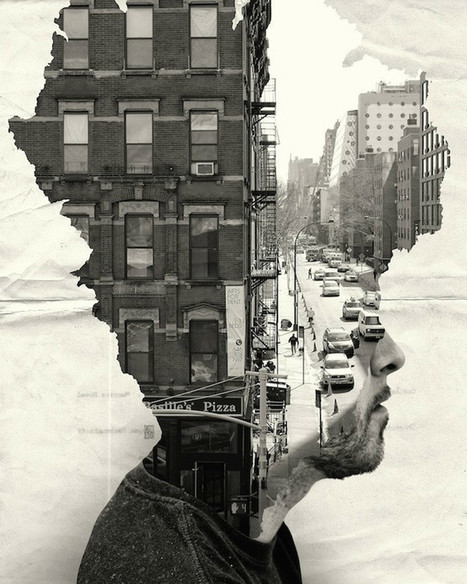
Andrea Constantini is an Italian photographer and graphic designer, and founder of PhotogtaphizeMag, an independent, free, electronic magazine. He believes that “photography in the modern has received the gift of digital”, a gift that he uses in his beautiful works. In his architecturalized collection, he emphasized the idea of the human mind is made for being constantly elsewhere, this being one of the single, most important distinctions between a “conscious man and an instinctive animal”, giving us the ability to overcome the boundaries of not only social restraints, economical differencies and other such daily struggles, but also infinite concepts such as space and time...
Via Lauren Moss
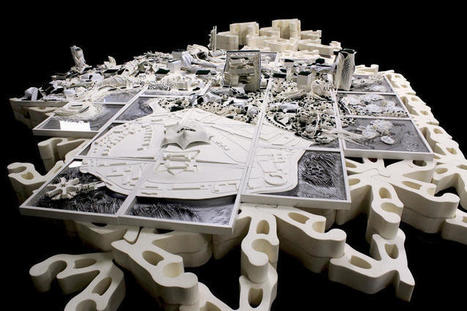
In 1939, visitors stood in line for hours to see the Futurama exhibit at the New York World's Fair, a detailed model imagining 1960s America. Complete with half a million tiny buildings and a million handmade miniature trees, it also visualized a network of highways crossing the country. And while the interstate system probably would have been built without it, it's arguable that the visualization—sponsored by GM—helped the roads happen. A new exhibit called the Future City, up now at London's Royal Institute of British Architects, looks at how drawings and models of futuristic cities can shape the cities that actually are built. "Visualizations of future cities contribute to our collective imagination," says Nick Dunn from Lancaster University "They provide us with visionary projections of how we might live. Reexamining these from a historical perspective can give us new insights and greater understanding of the developments and patterns that shape the present, and in turn, their implications for our future."
Via Lauren Moss
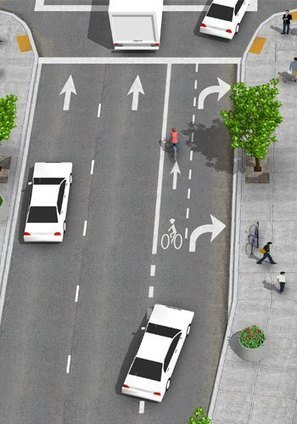
In 2000, the District of Columbia had three miles of bike lanes. Today, the district has roughly 80 miles of bike infrastructure, and many other U.S. cities have made similar investments. Bicycling Magazine’s top 50 bike friendly cities includes some unsurprising places at the top – Minneapolis, Portland, Boulder, Seattle – but also shows how cities such as Cleveland, Miami, and Baltimore have made important strides in the last several years to improve their bike systems. Several are members of the National Association of City Transportation Officials (NACTO), which has put out its best-selling Urban Bikeway Design Guide, first released in 2011, now with an updated second edition this year. NACTO’s updated second edition is part of their “sustained commitment to making city streets safer for everyone using them.” Reformatted with improved structure, it features photos, diagrams, and 3-D renderings of wide-ranging best practices in design for bike infrastructure...
Via Lauren Moss
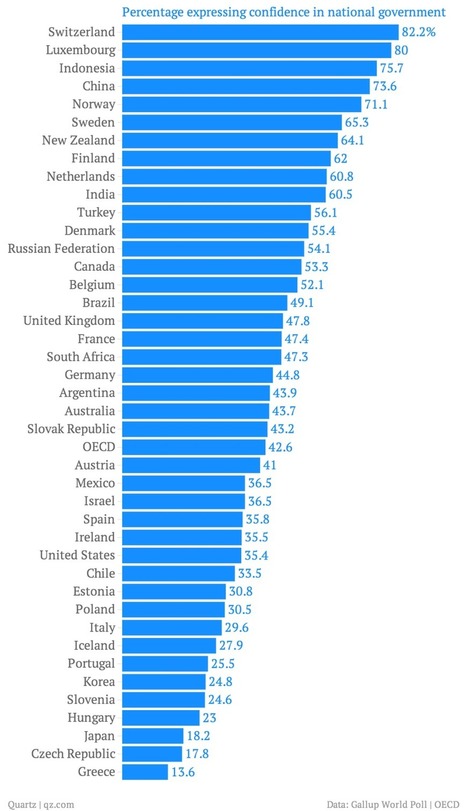
The Paris-based think tank known as the OECD is just out with its semi-annual survey of how different economies stack up in terms of social well-being. (Well-being is basically the polite way economists talk about happiness.) The organization even has a new data visualization to let you see where your country ranks in certain key measures. Called "Society at a Glance," the report is well worth a read. But here are some of the most interesting bits of data we found, in no particular order.
Via Lauren Moss
Mapmaker Max Roberts has created a new way to map out subway lines. Conventional maps usually emphasize “straight lines, clean angles and geographical accuracy”. Unlike those maps, Roberts’ circular design is a blend of “aesthetics and usability”.
Roberts discovered this “completely new way of designing maps” when he was designing a map for the London Underground that took into account the circular nature of the Orbital rail link. He realized the potential of the new design in forcing “cities into an unprecedented level of organization” and the coherence achieved. Sacrificing geographical accuracy, his schematic design shows how elements in the map relate to each other logically, while taming the web of criss-crossed lines usually found in subway maps.
View maps of the New York City Subway, the London Underground and the Paris Metro at the article link, or head over to hiswebsite to see more circular maps of other cities.
Via Lauren Moss
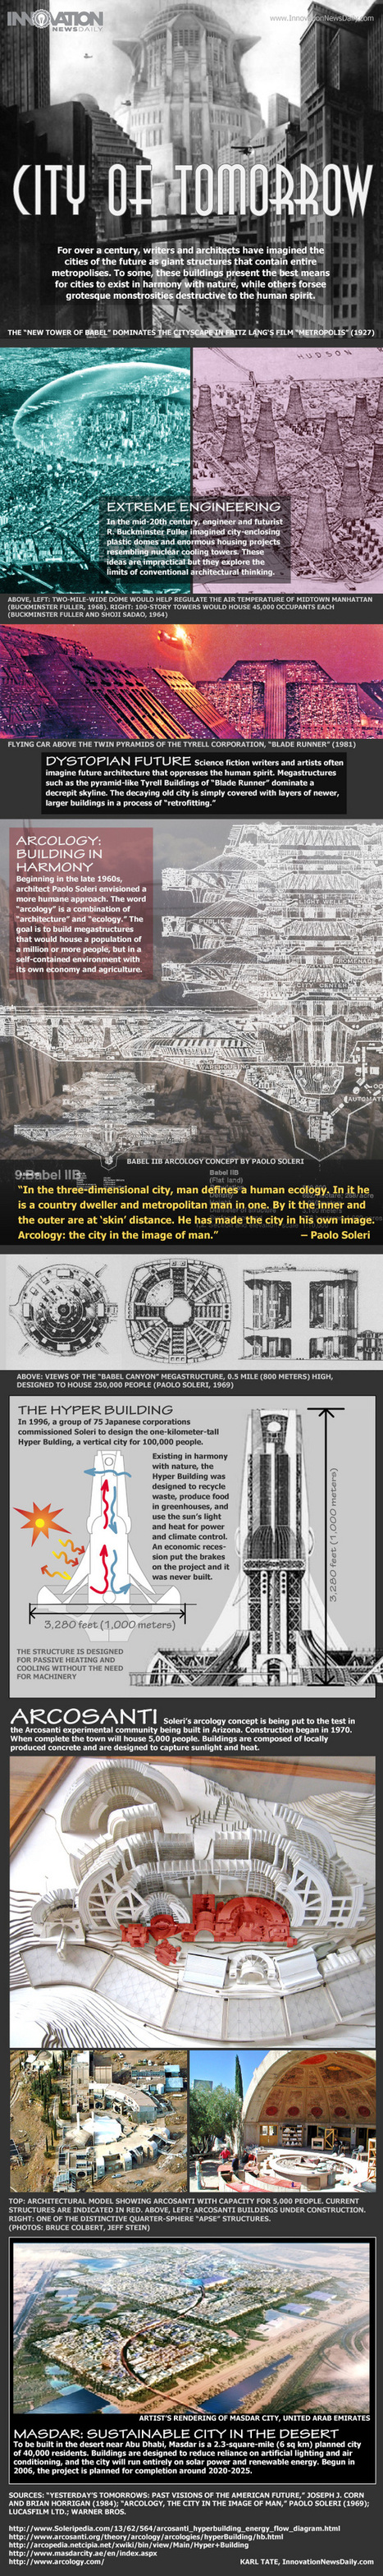
For over a century, writers and architects have imagined the cities of the future. In the late 1960s, architect Paolo Soleri envisioned “arcology” - a word that combines “architecture” and “ecology," with a goal of building structures to house large populations in self-contained environments with a self-sustaining economy and agriculture. “In the three-dimensional city, man defines a human ecology. In it he is a country dweller and metropolitan man in one. By it the inner and the outer are at ‘skin’ distance. He has made the city in his own image. Arcology: the city in the image of man.” (Paolo Soleri)
Via Lauren Moss
|
As a part of its EMBARQ Sustainable Urban Mobility initiative, the WRI Ross Center for Sustainable Cities has created a global reference guide called Cities Safer by Design “to help cities save lives from traffic fatalities through improved street design and smart urban development."
Via Lauren Moss
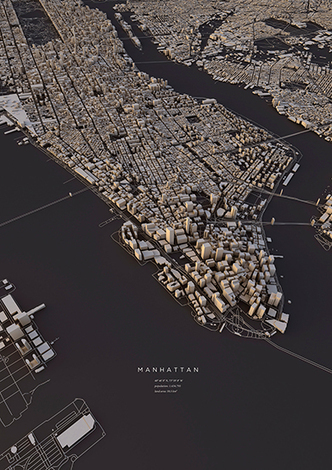
Topography, architecture and traffic routes give every city a unique structure.
'These conditions create the typical and individual inner structure of a city. I didn’t only want to show these structures in the conventional way from above, but also including the exact three-dimensionality of topography and buildings – a real world visualisation.
The OpenStreetMap data enabled me to visualize the satellite-based information using DEM Earth in Cinema 4D. The results are some extraordinary views of large capitals and small towns.'
Via Lauren Moss
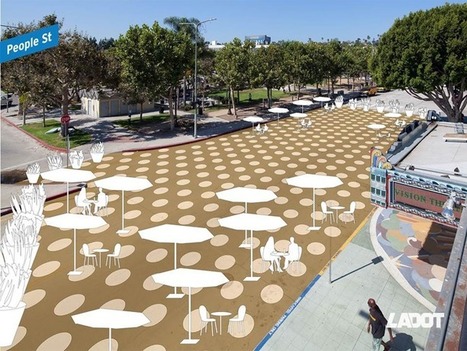
Despite an admittedly strong preference for the automobile, Los Angeles and other forward-thinking cities are now re-allocating public (and private) land away from the car so that people can use the space for other purposes. The automobile remains the best transportation option in all but a few U.S. cities. However, we can strike a better balance with how we use the precious resource of space in our cities. By dedicating so much land to traveling comfortably and quickly by car, we miss out on using that land to create interesting places to travel to. While some communities may still require copious amounts of parking and travel lanes, others are developing different neighborhood priorities, like green space, local business presence, or better biking and walking infrastructure. We need to plan for flexibility, for the accommodation of what we cannot yet imagine.
Via Lauren Moss
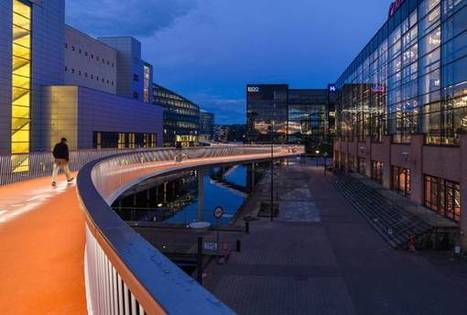
The Ambitious Cykelslangen by DISSING+WEITLING enables Copenhagen's vision to become the best cycling city in the world by the end of 2015. The 235-meter-long orange snake meanders 5.5 meters high above sea level from Havneholmen through the mall Fisketorvet, ending at Kalvebod Brygge. This “snake” is actually a ramp and a bridge, called the “Cykelslangen — The Bicycle Snake,” that provides more than 12,000 bicyclists with a safe route through this busy district every day. The architecture firm DISSING+WEITLING was asked to design a ramp to replace a nearby staircase. Instead of just designing a simple ramp, they went a step further and designed a bridge. The result is a destination and focal point that can be seen for miles from the air and has also completely transformed the area for all who enjoy it.
Via Lauren Moss
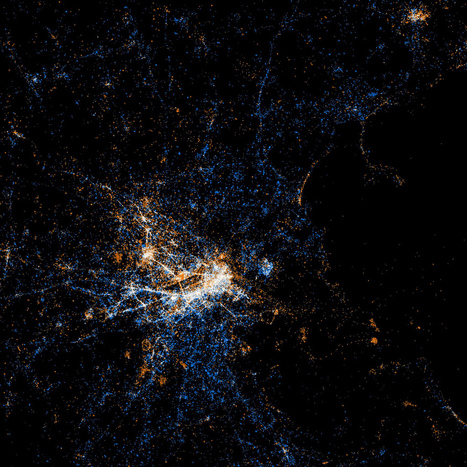
“Where people post geotagged photos to Flickr from and geotagged tweets to Twitter from.” via Eric Fischer Red dots are locations of Flickr pictures. Blue dots are locations of Twitter tweets. White dots are locations that have been posted to both.
Via Lauren Moss
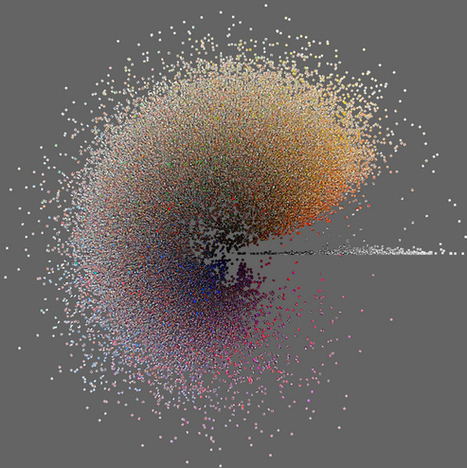
Social-media platforms like FourSquare and Twitter have been a boon for sociologists and geographers who now have entirely new ways of tracking how we move through cities, where we go, who we are, and even what we think of the world around us. There is one set of social-media platforms, however, that has been tougher to crack for useful data than others: photo-sharing sites.
Their metadata can illustrate where people take photos, and how active they are. But on the whole, how do you aggregate useful data about entire cities and the differences between them from the content of millions of photos on a site like Instagram? Researchers have been working on this for the past year, and they've just posted some of the initial results from their Phototrails project here.The project is less an exploration of a specific research question, and more a first foray into what we might learn by treating user-generated photography as another source of Big Data.
Via Lauren Moss
|