Design, Science and Technology
45.7K views | +0 today
Follow
Design, Science and Technology
#ideas #design #science #technology #inspiration #media #information
Your new post is loading...
Rescooped by Antonios Bouris from What's new in Visual Communication?
Scoop.it!

Overview Timelapse: A New Book Documents Vast Changes to the Earth’s Surface by Human Hands

Overview Timelapse: A New Book Documents Vast Changes to the Earth’s Surface by Human Hands | Design, Science and Technology | Scoop.it
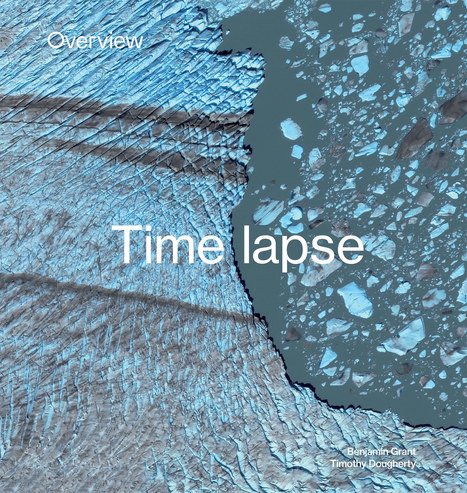
In a follow-up to the 2016 book Overview featuring stunning imagery of the Earth from above, Overview Timelapse: How We Change the Earth takes a critical look at the numerous ways humans have completely altered the surface of our planet in a very short time through urban development, climate change,

Via ECAL Library
No comment yet.
Rescooped by Antonios Bouris from green infographics
Scoop.it!

What is a Climate and Energy Indicator? | Infographic

What is a Climate and Energy Indicator? | Infographic | Design, Science and Technology | Scoop.it

This infographic is from the 2014 Environmental Performance Index. The Environmental Performance Index (EPI) ranks how well countries perform on high-priority environmental issues in two broad policy areas: protection of human health from environmental harm and protection of ecosystems. Within these two policy objectives the EPI scores country performance in nine issue areas comprised of 20 indicators. Indicators in the EPI measure how close countries are to meeting internationally established targets or, in the absence of agreed-upon targets, how they compare to the range of observed countries.


Via Lauren Moss
No comment yet.