Design, Science and Technology
45.7K views | +0 today
Follow
Design, Science and Technology
#ideas #design #science #technology #inspiration #media #information
Your new post is loading...
Rescooped by Antonios Bouris from green infographics
Scoop.it!

An Eye-Opening Map of the Future of Global Development

An Eye-Opening Map of the Future of Global Development | Design, Science and Technology | Scoop.it

By 2050, the world’s population is projected to approach nine billion. With more people will come more developed land—a lot more.

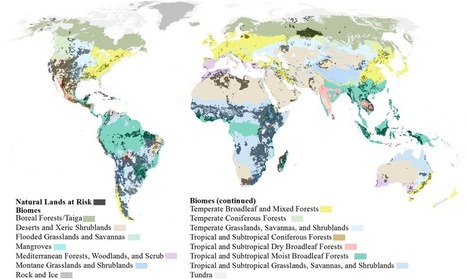
Urbanization, agriculture, energy, and mining put 20 percent of the world’s remaining forests, grasslands, and other natural ecosystems at risk of conversion by 2050.

With that kind of expansion, there are sure to be harms—namely clean water, clean air, and biodiversity. 

To mitigate some of those risks, scientists and geographers at the Nature Conservancy have taken a crucial step by mapping the potential impact that human growth will have on natural lands.

It’s the most comprehensive look to date at how major forms of development will take over fragile ecosystems, if left unchecked...


Via Lauren Moss
CTy Thiet Ke Kien Truc Neohouse's comment, October 3, 2017 10:46 PM
Bài viết rất hữu ít . Cùng tôi chia sẻ những điều hữu ít đi .
Rescooped by Antonios Bouris from visual data
Scoop.it!

Datascaping And Designing With Information

Datascaping And Designing With Information | Design, Science and Technology | Scoop.it

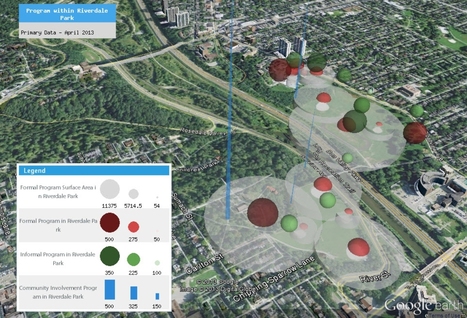
DataAppeal software provides an alternative to complex mapping tools through an easy to use, web-based GIS application that renders typical data files into beautifully designed multi-dimensional maps and datascapes instantly. For architects, landscape architects, urban planners and designers of the built form, the application is a great tool to utilize evidence-based information to expose new site patterns, to provide alternative 3D modes of mapping for communication purposes, and to aid in the initiation of master plan designs.

It’s also a refreshing way to visually engage professional and students with their site-based data...


Via Lauren Moss
burlysand's comment, September 24, 2013 3:28 AM
Pretty simple..
Rescooped by Antonios Bouris from visual data
Scoop.it!

Hot Spots: Mapping the World's Most Photographed Locations

Hot Spots: Mapping the World's Most Photographed Locations | Design, Science and Technology | Scoop.it

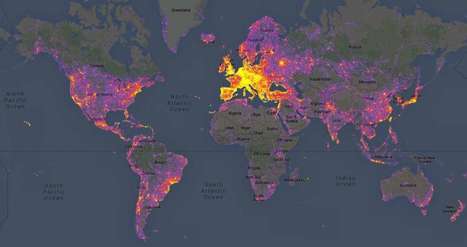
Sightsmap forms an aggregation of the most photographed buildings by integrating Google's Panoramio, which allows users to tag a location or attraction within their photo.


In a colorful gradient of purples, reds, and yellows, the website reveals the most photographed places around the globe. Broad patches of purple coincide with a lesser amount of photographs, while smaller clusters of yellow reveal the locations where people can't seem to put their cameras down. Unsurprisingly, the densest areas of yellow are the world's most popular tourist spots − including New York City and cities across Europe such as Istanbul.

Sightsmap is more than just a map of tourist destinations however; it also shows the close connection between architecture and what inspires people to take photos. Sightsmap forms an aggregation of the most photographed buildings by integrating Google's Panoramio, which allows users...


Via Lauren Moss
No comment yet.