


Looking for some social media stats to use for your strategy or in your next presentation? You will find what you need in the list below -- updated to October 2014.
Get Started for FREE
Sign up with Facebook Sign up with X
I don't have a Facebook or a X account


 Your new post is loading... Your new post is loading...
Looking for some social media stats to use for your strategy or in your next presentation? You will find what you need in the list below -- updated to October 2014. 
![45 Amazing Social Media Facts of 2013 [Infographic] | Design, Science and Technology | Scoop.it](https://img.scoop.it/-80FLjnbZ8zgaLTCTqO1Djl72eJkfbmt4t8yenImKBVvK0kTmF0xjctABnaLJIm9)
Everyday Social Media numbers are growing, and here are 45 facts in an infographic by Digital Insights. A few of the statistics: 40% of marketers use Google+, 70% desire to learn more and 67% plan to increase Google+ activities 42% update their profile information regularly on LinkedIn Every second 8000 users like some or other photo on Instagram 80% of total Pinterest’s pins are re-pins 4.2 billion people use mobile device to access social media sitesVia Lauren Moss

Lee Werrell's curator insight,
September 20, 2013 9:33 AM
Even more amazing facts; and these can be useful for marketers! 
Bruce McDuffee's curator insight,
September 25, 2013 11:30 PM
Interesting stats, but for the business marketer, does it convert to revenue?
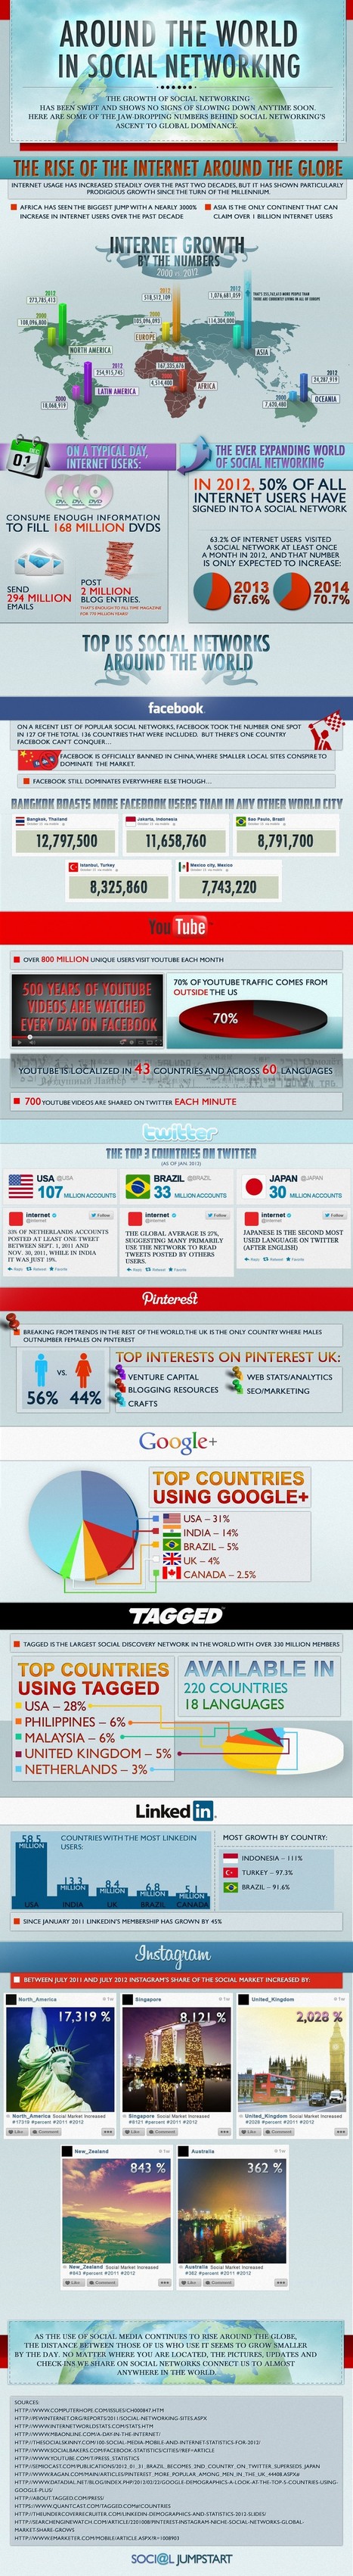
The world of social media is increasing and has a powerful role to play in the future. In 2012, more than 63% of online users visited more number of social media websites than any other types, and that number is expected to continue going up through 2013. View this infographic to find more statistics about online behavior and the use of Facebook, Twitter, LinkedIn, YouTube, Pinterest and Instagram across the globe... Via Lauren Moss

Angie Mc's curator insight,
January 26, 2014 10:13 AM
Making friends worldwide is one of the best parts of participating in social media. I especially love how Twitter makes it easy to connect across time zones. 
Lydia Gracia's curator insight,
February 14, 2014 5:20 AM
La Guia completa del Social Media en el Mundo

A demographic portrait of humanity if the world were 100 people. From data source, 100people.org: The world population has now reached 7 billion people. This milestone inspired us to conduct research to update our statistics, and the changes over the past 5 years are remarkable. In 2006, only 1 person out of 100 would have had a college education-- today that number has jumped to 7 thanks in part to advances in higher education in Asia. The detailed research and source information can be found here and the statistics provided by Donella Meadows in 1990 that originally inspired our project can be viewed here.Via Lauren Moss

Aurélia-Claire Jaeger's curator insight,
March 29, 2013 6:03 AM
J'aime bien ce coup d'oeil sur notre monde ... |
![What Does a Day in Social Media Look Like? [Infographic] | Design, Science and Technology | Scoop.it](https://img.scoop.it/OLyOWGpFWN3QSdHG45cqRjl72eJkfbmt4t8yenImKBVvK0kTmF0xjctABnaLJIm9)
Of the world's roughly 7 billion people, 40% use social media daily. So, what are those folks doing on the major social platforms? The following infographic by Saxum shows the daily activity on Facebook, Twitter, LinkedIn, Pinterest, Vine, Google+, and Tumblr, measured against each platform's total user base. On Facebook, some 23% of users check newsfeed more than five times a day, 2.7 billion people give Facebook posts a Like, and Twitter's active users contribute 400 million tweets a day... Via Lauren Moss

Victor Juarez's curator insight,
January 31, 2014 2:43 PM
Muy interesante! datos de trafico en RRSS a nivel mundial, 7 Billones de personas conectadas y el Prime Time a las 15h !
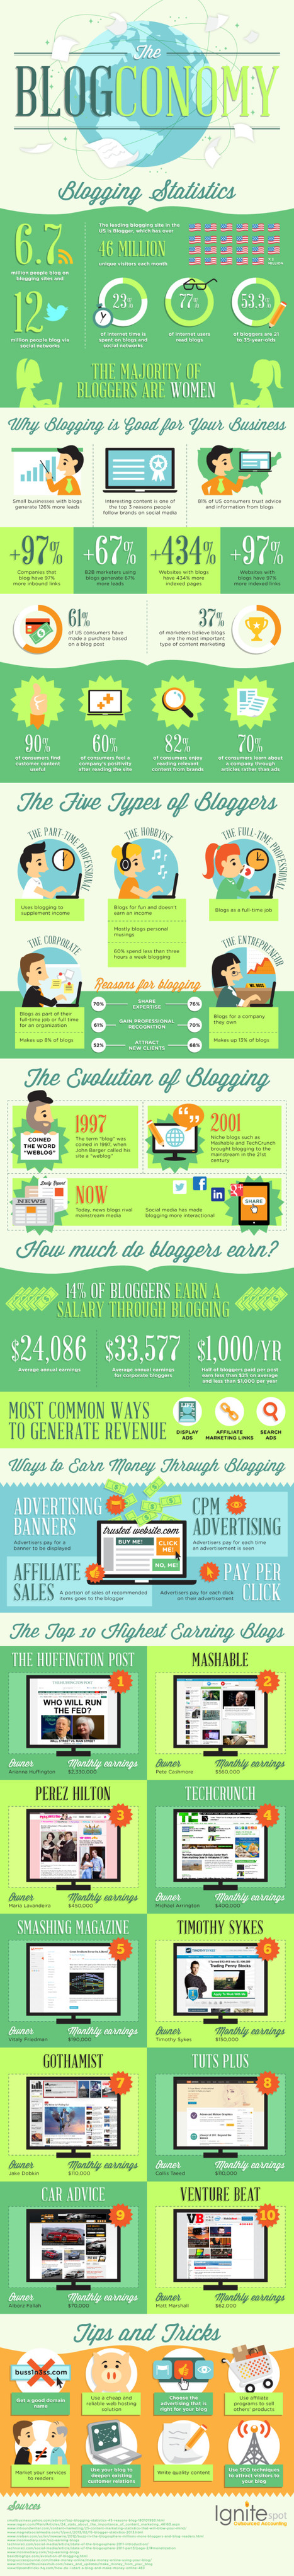
This infographic has some interesting data and statistics regarding blogging. For example, 61% of US consumers have made a purchase based on a blog post. See the graphic for more.. Via Lauren Moss

Jeff Domansky's curator insight,
September 17, 2013 6:23 PM
Valuable reference point for bloggers. Another H/T to Lauren Moss for sharing it. 
jmwakasege's curator insight,
September 25, 2013 11:54 PM
Very detailed infographic to date about blogging. 
Rosemary Davey's curator insight,
September 30, 2013 6:53 AM
Looking forward to seeing how ENv2 changes this dynamic.
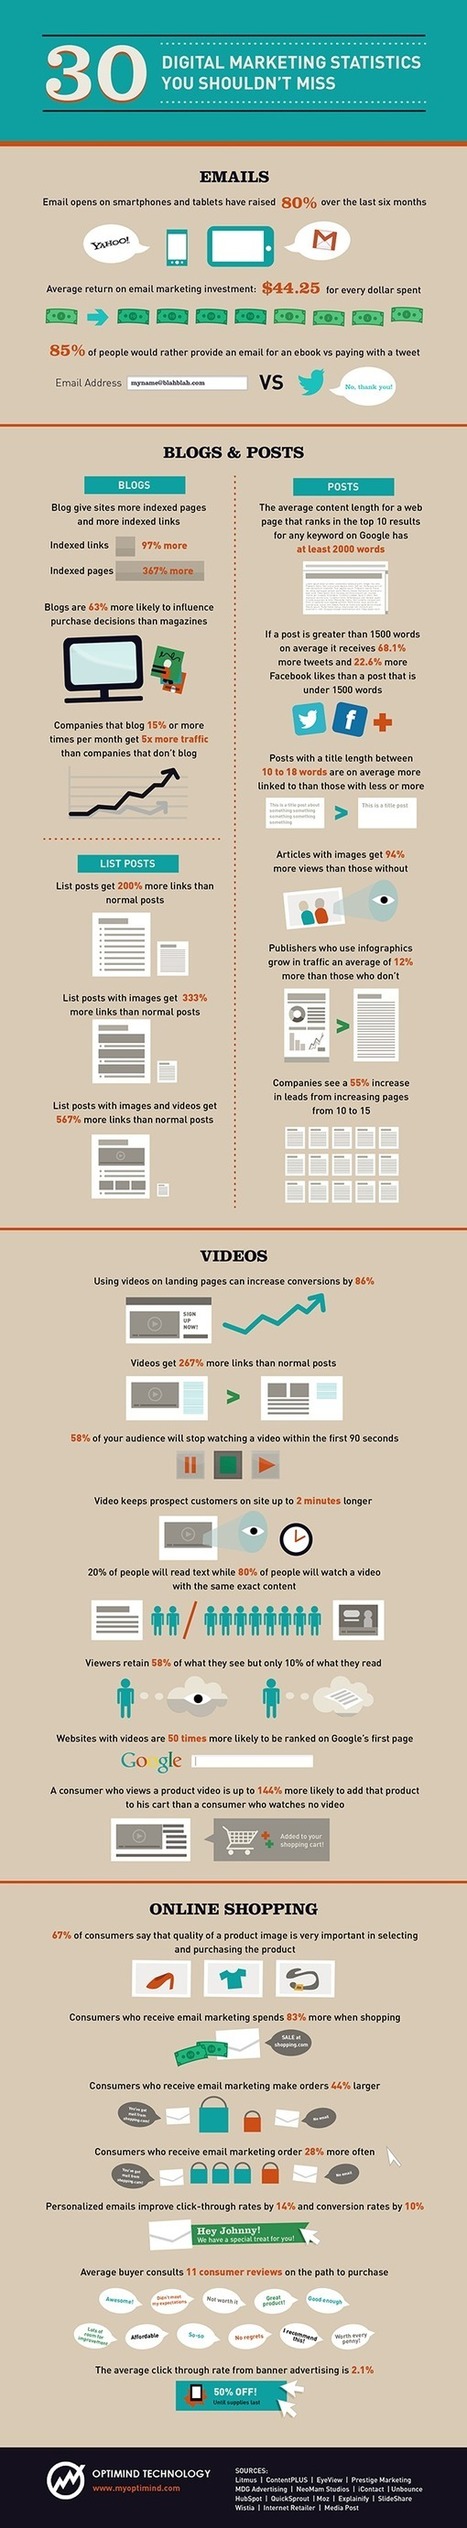
A useful collection of statistics about digital marketing, including: -Emails opened on smartphones & tablets has increased 80% over the past six months. - a post with more than 1,500 words receives 68.1% more tweets and 22.6% more Facebook likes. - Viewers retain 58% of what they see but only 10% of what they read - 20% of people will read text while 80% of people will watch a video with the same exact content. More statistics at the link... Via Lauren Moss

Bart van Maanen's curator insight,
August 25, 2013 6:37 AM
De veranderingen in online gedrag en technologie gaan snel. Deze infographic geeft daar wat actueel inzicht in. Opmerkelijk is dat het laatste half jaar een stijging wordt gezien van 80% in het openen van e-mail op mobiel en tablet.
![How Users Interact on Pinterest [infographic] | Design, Science and Technology | Scoop.it](https://img.scoop.it/mRVmKurhwDsyMDaupN3AOjl72eJkfbmt4t8yenImKBVvK0kTmF0xjctABnaLJIm9)
This visual guide details how users are interacting with pins, boards, other users and brands on Pinterest. Via Lauren Moss
|


Figures