Design, Science and Technology
45.8K views | +3 today
Follow
Design, Science and Technology
#ideas #design #science #technology #inspiration #media #information
Your new post is loading...
Rescooped by Antonios Bouris from visual data
Scoop.it!

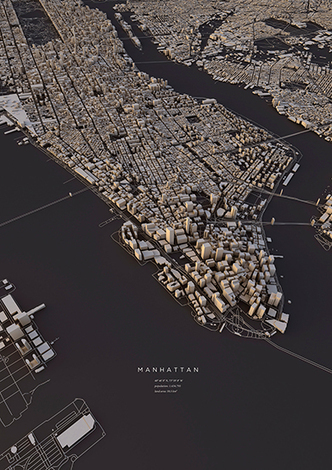
City Layouts Created with OpenStreetMap Data

City Layouts Created with OpenStreetMap Data | Design, Science and Technology | Scoop.it

Topography, architecture and traffic routes give every city a unique structure.
'These conditions create the typical and individual inner structure of a city. I didn’t only want to show these structures in the conventional way from above, but also including the exact three-dimensionality of topography and buildings – a real world visualisation.
The OpenStreetMap data enabled me to visualize the satellite-based information using DEM Earth in Cinema 4D. The results are some extraordinary views of large capitals and small towns.'


Via Lauren Moss
No comment yet.
Rescooped by Antonios Bouris from green infographics
Scoop.it!

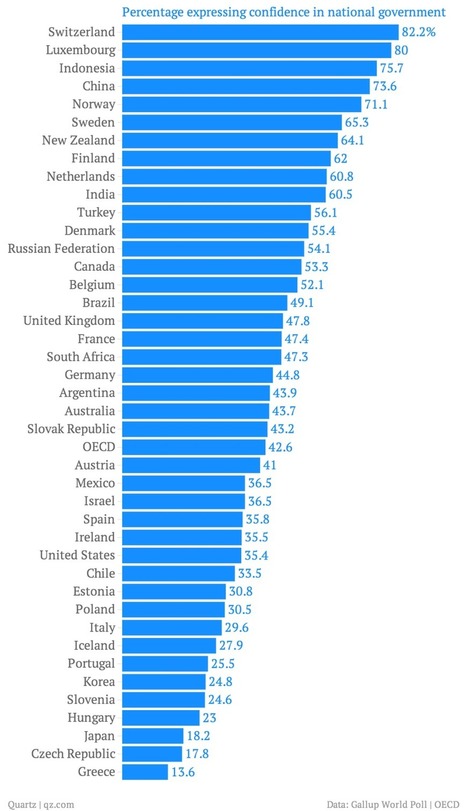
9 Charts That Tell You Where Life Is Pretty Terrific

9 Charts That Tell You Where Life Is Pretty Terrific | Design, Science and Technology | Scoop.it

The Paris-based think tank known as the OECD is just out with its semi-annual survey of how different economies stack up in terms of social well-being. (Well-being is basically the polite way economists talk about happiness.) The organization even has a new data visualization to let you see where your country ranks in certain key measures.

Called "Society at a Glance," the report is well worth a read. But here are some of the most interesting bits of data we found, in no particular order.


Via Lauren Moss
Ma. Caridad Benitez's curator insight, March 20, 2014 11:47 AM

Un análisis de datos a la VENA!