Design, Science and Technology
45.8K views | +0 today
Follow
Design, Science and Technology
#ideas #design #science #technology #inspiration #media #information
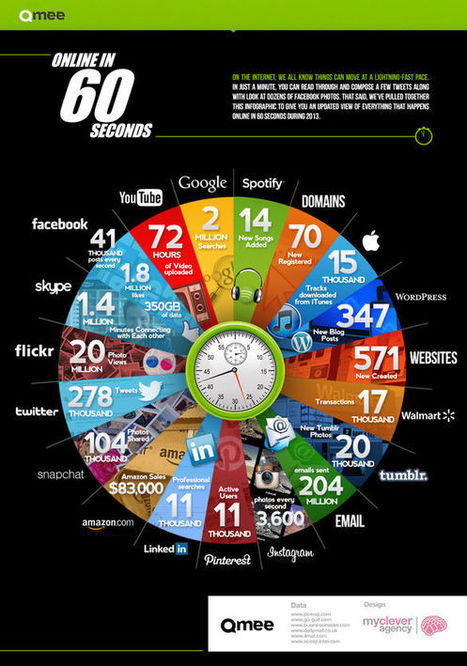
Your new post is loading...
Rescooped by Antonios Bouris from visual data
Scoop.it!

A Perspective on Time | Visual.ly

A Perspective on Time | Visual.ly | Design, Science and Technology | Scoop.it

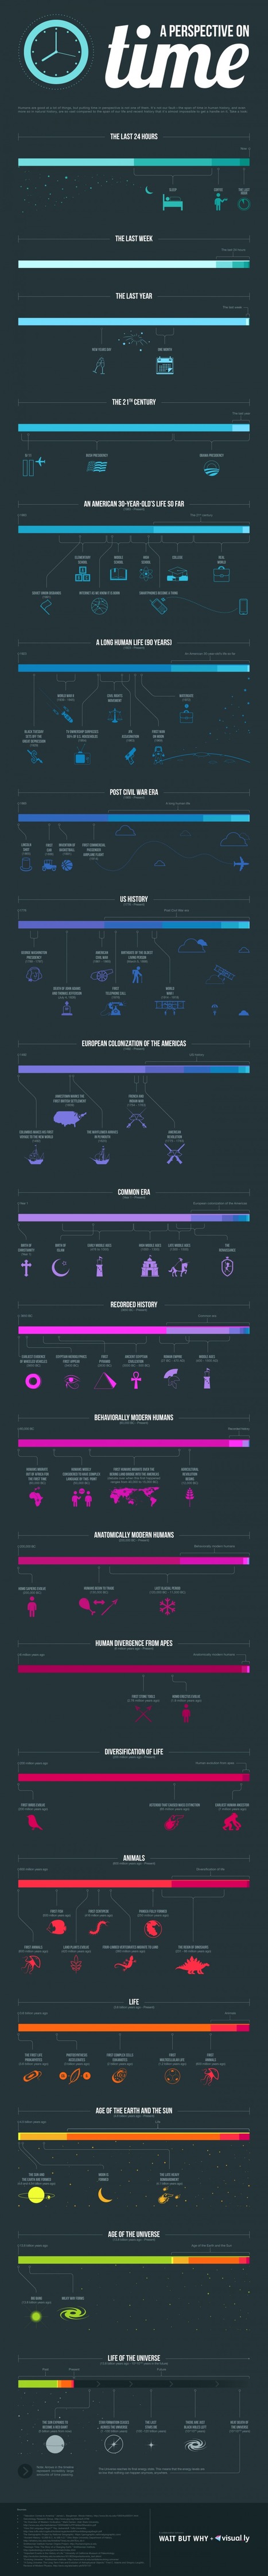
'Humans are good at a lot of things, but putting time in perspective is not one of them. It's not our fault - the span of time in human history, and even more so in natural history, are so vast compared to the span of our life and recent history that it's almost impossible to get a handle on it.'

View the information sources and data here.


Via Lauren Moss
No comment yet.
Rescooped by Antonios Bouris from visualizing social media
Scoop.it!

Take A Look At What Happens Every Single Minute On The Internet

Take A Look At What Happens Every Single Minute On The Internet | Design, Science and Technology | Scoop.it
Early last year we learned that one hour of YouTube is uploaded every second. It was a bracing reminder of just how many people are spending their time online simultaneously.


Created by rewards site Qmee, the infographic "Online In 60 Seconds" is a pie chart that shows off the sheer amount of online activity that takes place every single minute. The amount of YouTube videos uploaded has already increased from January 2012's 60 hours per minute to 72. Additionally, over 1.8 million things are liked on Facebook, and 278 thousand bon mots tweeted. Not depicted in the chart: the amount of work that is going undone while all of these items are being viewed.


Via Lauren Moss
Sois Islam's comment, August 25, 2013 12:39 AM
hello, thnxz for viewing !
Sois Islam's comment, August 25, 2013 12:39 AM
Dear Mr. Mithu thanks for the action.
Angie Thao's curator insight, May 15, 2016 7:06 PM

Single Chart Infograph:

Like: Good visual, good data.

Dislike: Can be a little overwhelming to look at.