Human Interest
198.8K views | +0 today
Human Interest
Your new post is loading...
Scooped by Skuuppilehdet
Scoop.it!

Creating RI's Off-Shore Wind Farm

Creating RI's Off-Shore Wind Farm | Human Interest | Scoop.it
Today, to the southeast of Block Island, there are five new structures rising from the ocean. These are the towers of the Block Island Wind Farm (BIWF), the first offshore wind energy installation in the United States. The turbines will generate 30 megawatts of energy; providing electricity to 17,000 households on Block Island and coastal Rhode Island (McCann, 2016), and replacing the diesel generators that previously powered New Shoreham. The turbines are on schedule to begin turning in November 2016 once commissioning is complete.
No comment yet.
Rescooped by Skuuppilehdet from AP Human Geography
Scoop.it!

Interactive Climate Map

Interactive Climate Map | Human Interest | Scoop.it

"Obsessed as we are with cartography we in Staridas Geography perceive any aspect of the actual 3D World as a constant opportunity for another pretty map creation!"


Via Alex Smiga
GTANSW & ACT's curator insight, August 19, 2016 7:47 PM

Great map to discuss global distribution of biomes and links to climate 

Sally Egan's curator insight, August 21, 2016 6:24 PM
Fun way for students to learn about the diverse climates around the world, by selecting a location on the map students are shown the climatic data of the selected place.
Rescooped by Skuuppilehdet from HMHS History
Scoop.it!

Using 'Geography Education'

Using 'Geography Education' | Human Interest | Scoop.it

"This story map was created with ArcGIS Online to guide users on how to get the most out of the Geography Education websites on Wordpress and Scoop.it."


Via Michael Miller
Ruth Reynolds's curator insight, December 3, 2016 9:33 PM
Just getting familiar with ArcGis and lots of ideas picked up at #ncss16
Olivia Campanella's curator insight, September 5, 2018 4:09 PM
This map is a very helpful, useful and fun guide on how to get the most of this website and to learn about geography and different places and facts of the world. 
Dominic Mappas's curator insight, June 5, 2019 6:41 AM
This source allows its viewers to select countries to direct them to a series of topic links. This allows the audience to interact and explore the world through visual representation of the globe. I can see this being implemented for warm up activities, quizzes and practice questions. Great source! 
Scooped by Skuuppilehdet
Scoop.it!

What Did Chicago Look Like Before the Great Fire?

What Did Chicago Look Like Before the Great Fire? | Human Interest | Scoop.it
This 1868 pocket map of Chicago shows the city in full-blown expansion, a mere 3 years before the infamous blaze
No comment yet.
Scooped by Skuuppilehdet
Scoop.it!

Motion of Tectonic Plates

"This video is from the BBC documentary film Earth: The Power Of The Planet.  The clip is also embedded in this story map that tells the tale of Earth’s tectonic plates, their secret conspiracies, awe-inspiring exhibitions and subtle impacts on the maps and geospatial information we so often take for granted as unambiguous."


Tags physical, tectonics, disasters, mapping, geospatialmapping, video, ESRI.

Scooped by Skuuppilehdet
Scoop.it!

Have Humans Really Created a New Geologic Age?

Have Humans Really Created a New Geologic Age? | Human Interest | Scoop.it
We are living in the Anthropocene. But no one can agree when it started or how human activity will be preserved


Tags: ESRI, anthropocene, environment depend, sustainability

Miroslav Sopko's curator insight, January 6, 2015 3:27 AM

Ako vzniká antroposféra...

Rescooped by Skuuppilehdet from AP HUMAN GEOGRAPHY DIGITAL STUDY: MIKE BUSARELLO
Scoop.it!

World Record Mapping Event

World Record Mapping Event | Human Interest | Scoop.it

Join our FREE GIS Day World Record mapping event taking place during Geography Awareness week (Nov 17th -21nd 2014, video with more details).  With a local to global perspective, we want students to map their thoughts and feeling about their local area.


They can add their data to a global map that is shared with the world. Help us achieve our goal of having 100,000 students take part globally.  The event will provide great opportunities for:


Using the latest GIS technologySpatial thinkingData analysis with GISMap designConnecting students with their peers worldwide

Tags: mapping, GIS,  K12, ESRI, geospatial, edtech.


Via Mike Busarello's Digital Storybooks
Courtney Barrowman's curator insight, October 6, 2014 12:19 PM

We are totally doing this!!!! Unit 1

Scooped by Skuuppilehdet
Scoop.it!

The Real Pirates of the Caribbean

The Real Pirates of the Caribbean | Human Interest | Scoop.it
Explore the travels and exploits of five real pirates of the Caribbean. Click through the tabs to track the adventures of each pirate overlaid on Spanish ports and pirate strongholds in the area. Zoom into the map to see additional detail.
Jared Medeiros's curator insight, February 11, 2015 10:00 PM

This pirate excursion map is so cool and gives a great look at the travels of different pirates.  As we get farther away from these time periods, it seems like the idea of these Caribbean pirates are fictional.  To hear true historical events about these individual pirates is very interesting.  I would  love to take a time machine back to Port Royal during these times to experience that madness.

Brian Wilk's curator insight, March 28, 2015 9:34 AM

Imagine the horror a native of the Caribbean must have felt when white men came into their scenic lands and pillaged their villages and plundered their treasuries? Blackbeard otherwise known as Edward Teach, would light slow burning cannon fuses and place them in his beard to create an aura about him as he fought and raided these port of call. Calico Jack Rackham, a great pirate name if there ever was one, was best known for having  a pair of female pirates aboard. Instantly becomes one of my heroes! Then you have William Parker who was actually an opportunist backed by England who plundered Spanish treasures throughout Central America. Here is my favorite pirate joke; what is a pirate's favorite letter? "R" you say? No, it's the letter "C", pirates love the sea....

Dr. Helen Teague's curator insight, September 14, 2015 9:28 AM

very interesting interactive map

Rescooped by Skuuppilehdet from AP HUMAN GEOGRAPHY DIGITAL STUDY: MIKE BUSARELLO
Scoop.it!

WORKSHEETS: Climate Migrants

WORKSHEETS: Climate Migrants | Human Interest | Scoop.it

"The ESRI storymap on climate refugees does a phenomenal job sampling locations in the world that experience migration effects as a result of climate change. Attached is a guided worksheet that accompanies the ESRI Climate Migrant Storymap."


Via Michael Miller, Mike Busarello's Digital Storybooks
Ivan Ius's curator insight, January 26, 2017 2:51 PM
Geographic Concepts: Spatial Significance, Patterns and Trends, Interrelationships, Geographic Perspective
Scooped by Skuuppilehdet
Scoop.it!

Interactives about Syrian Refugee Crisis

Interactives about Syrian Refugee Crisis | Human Interest | Scoop.it
War, sectarian violence, and famine have forced more than 50 million people from their homes—the largest number of displaced people since World War II.
Skuuppilehdet's insight:

Here are two excellent ESRI StoryMaps about the Syrian refugee crisis; these are two very good examples of a great web maps. 


Tags: GIS, ESRI, mapping, cartography, geospatial, edtech, Syria, political, refugees.

Mr. D's Social Studies Classroom's curator insight, March 2, 2016 5:34 PM

Here are two excellent ESRI StoryMaps about the Syrian refugee crisis; these are two very good examples of a great web maps. 

'The Uprooted' (focused more on Syria).
Epicenter of a Deepening Refugee Crisis (puts Syria into larger global patterns).


Tags: GIS, ESRI, mapping, cartography, geospatial, edtech, Syria, political, refugees.

malbert's curator insight, March 4, 2016 1:30 AM

Here are two excellent ESRI StoryMaps about the Syrian refugee crisis; these are two very good examples of a great web maps. 

'The Uprooted' (focused more on Syria).
Epicenter of a Deepening Refugee Crisis (puts Syria into larger global patterns).


Tags: GIS, ESRI, mapping, cartography, geospatial, edtech, Syria, political, refugees.

Rachel Stutzman's curator insight, March 11, 2016 10:28 AM

Here are two excellent ESRI StoryMaps about the Syrian refugee crisis; these are two very good examples of a great web maps. 

'The Uprooted' (focused more on Syria).
Epicenter of a Deepening Refugee Crisis (puts Syria into larger global patterns).


Tags: GIS, ESRI, mapping, cartography, geospatial, edtech, Syria, political, refugees.

Scooped by Skuuppilehdet
Scoop.it!

Human activities are reshaping Earth's surface

Human activities are reshaping Earth's surface | Human Interest | Scoop.it

"By moving the slider, the user can compare 1990 false-color Landsat views (left) with recent true-color imagery (right). Humans are increasingly transforming Earth’s surface—through direct activities such as farming, mining, and building, and indirectly by altering its climate."

James Piccolino's curator insight, March 24, 2018 9:46 AM
Wow. This is depressing. I knew of the Aral sea thanks to class, but the others I had no idea. They were so green and lush way back in the day. Now they are dead and seriously in a sad state. There is nothing wrong with development and advancement, but this is just a lot when it comes to impact.
othni lindor's curator insight, October 20, 2018 4:01 AM
This map shows how human activities like farming has shaped the Earth's surface. The example they show is the Aral Sea. It is a 
regional environmental problem. It is located between the Southern part of Kazakhstan and Northern Uzbekistan. It used to be the world's fourth largest saline lake. Human activities have caused the lake to be almost completely dried up. Over the years, the Aral Sea became polluted with pesticides and chemicals. 


Stevie-Rae Wood's curator insight, October 28, 2018 9:51 PM
The Aral Sea is a severe environmental issue in Central Asia. This map that we are looking at shows how human activities such as farming have destroyed a natural wonder. The Aral Sea USED to be the fourth largest saline lake but has dried up. The Aral Sea has five times less volume and is five times more saltier than it once was. This occurred because people surrounding the area used more water and used it more intensely. The soviets thought it would be a good idea to use more water projects such as planting cotton, and rice which are water intense crops. This severely dried up the Sea. The area that the sea once was that is now dry land in uninhabitable because of the levels of salt left behind. As well the rivers that connected to the Aral Sea have either dried out or are on the verge of drying out causing many economic problems for those that depended on that water.
Rescooped by Skuuppilehdet from Stage 4 Water in the World
Scoop.it!

Where Does Your Water Come From?

Where Does Your Water Come From? | Human Interest | Scoop.it

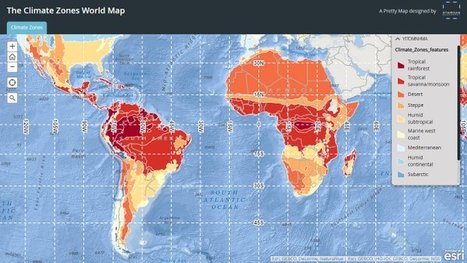
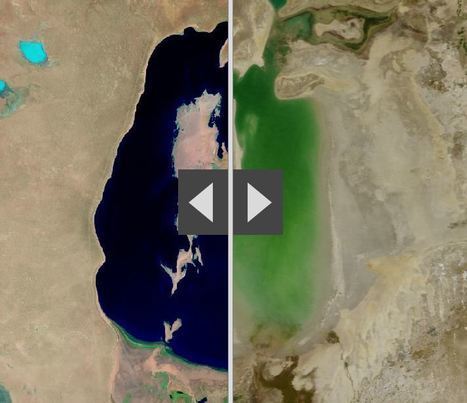
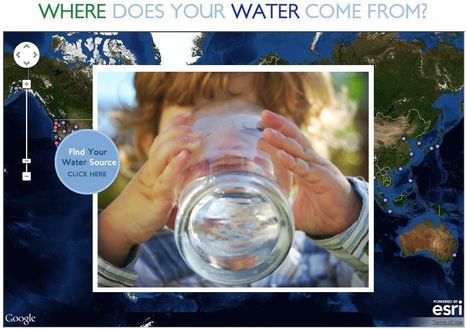
This interactive map documents where 443 million people around the world get there water (although the United States data is by far the most extensive).  Most people can't answer this question.  A recent poll by The Nature Conservancy discoverd that 77% of Americans (not on private well water) don't know where their water comes from, they just drink it.  This link has videos, infographics and suggestions to promote cleaner water.  This is also a fabulous example of an embedded map using ArcGIS Online to share geospatial data with a wider audience.  


Tags: GIS, water, fluvial, environment, ESRI, pollution, development, consumption, resources, mapping, environment depend, cartography, geospatial. 


Via GTANSW & ACT
No comment yet.
Scooped by Skuuppilehdet
Scoop.it!

An earthquake felt across South Asia

An earthquake felt across South Asia | Human Interest | Scoop.it

"The magnitude-7.8 earthquake that struck Nepal on Saturday morning destroyed parts of Kathmandu, trapped many people under rubble and killed more than 2,500 people. It was the worst to hit the country since a massive 1934 temblor killed more than 8,000."

Joshua Mason's curator insight, April 29, 2015 11:04 AM

It's absolutely devastating what happened to Nepal. Any loss of life is a tragedy but loss of this scale is unimaginable. It's going to be a difficult rebuilding process for the Nepalese whether that's coping with the loss or physically rebuilding the nation.


Watching footage of shakes, what struck me the most was hundreds of year old temples crumbling. Those just aren't something you can easily rebuild. The building can eventually be replaced but the significance of it is almost lost. 


Those temples, like the homes in the area, were most likely not built up to a standard that could withstand earthquakes or at least earthquakes of this magnitude. It's easy to see how destruction on this scale can occur in large urban populations that were not designed to stand against such a dramatic event.

Kristin Mandsager San Bento's curator insight, May 1, 2015 3:59 PM

I've experienced earthquakes more times than I've ever felt the need.  We used to get them all the time it seemed in Japan.  My bed would role across the room.  It got to the point where I just slept through them.  If I had even felt a shake half as violent as what Nepal went through I could not even imagine the fright.  I wonder how long the India and Eurasia tectonic plates will stay on top of each other?  Or if a few more earth quakes will split the area?  

GTANSW & ACT's curator insight, June 1, 2015 1:52 AM

Australian Curriculum

The causes, impacts and responses to a geomorphological hazard (ACHGK053)


GeoWorld 8

Chapter 4: Hazards: causes, impacts and responses

(4.5 - 4.6 Earthquakes)

Scooped by Skuuppilehdet
Scoop.it!

Megacities Interactives

Megacities Interactives | Human Interest | Scoop.it

"By 2025, the developing world, as we understand it now, will be home to 29 megacities. We explore the latest UN estimates and forecasts on the growth of these 'cities on steroids', and take a look at the challenges and opportunities megacities present for the tens of millions living in Lagos, Mexico City and Dhaka."

Gilbert C FAURE's curator insight, October 27, 2014 3:40 PM

and wuhan inside

Katelyn Sesny's curator insight, October 31, 2014 11:48 AM

This article asks and answered the question of how and when we will reach a time and place where we live will be limited (as we weigh down the world)? -UNIT 1

Scooped by Skuuppilehdet
Scoop.it!

Explore old maps of US cities

Explore old maps of US cities | Human Interest | Scoop.it

"This cool new historic mapping app from the folks at esri and the U.S. Geological Survey is worth exploring.  What it does is take 100 years of USGS maps and lets you overlay them for just about any location in the nation. That allows users to see how a city – say Harrisburg – developed between 1895 and today.  The library behind the project includes more than 178,000 maps dating from 1884 to 2006."

PIRatE Lab's curator insight, August 13, 2014 12:25 PM

For more ESRI maps that let you explore urban environmental change, the 'spyglass' feature gives these gorgeous vintage maps a modern facelift (but not available for as many places). The cities that are in this set of interactive maps are: 


Chicago (1868)Denver (1879) Los Angeles (1880)Washington D.C.(1851)New York City (1836)San Francisco (1859)
Hongsheng Li's curator insight, August 14, 2014 12:40 AM
古今地图对比
Scooped by Skuuppilehdet
Scoop.it!

Place-based Geography Videos

Place-based Geography Videos | Human Interest | Scoop.it

Professor Seth Dixon shares over 50 of his favorite geography videos in this online map http://bit.ly/KDY6C2

Melissa Marie Falco-Dargitz's curator insight, November 3, 2014 12:02 PM

It was nice to see where everything was happening. I hope it gets updated to more current events. I wish we had something like this when we were looking at the invasion of Kuwait.

Caroline Ivy's curator insight, March 15, 2015 5:19 PM

Seth Dixon uses ArgGIS to juxtapose maps with the location a video is associated with. 


This idea has crossed my mind before. Now, a video can be contemplated with the spatial accuracy needed. This connects events to a place, and can help students more fully grasp the geospatial distribution of events. 

Nita Ardi's curator insight, January 14, 2019 12:16 PM
Great resource for classroom and information to get kids going.