


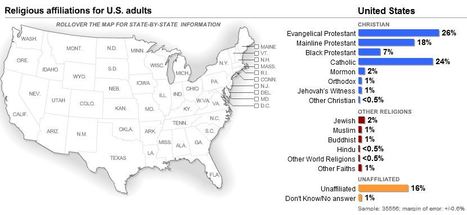
The Pew U.S. Religious Landscape Study religion map diagrams which religions have the highest populations in each state.
Via CT Blake
Get Started for FREE
Sign up with Facebook Sign up with X
I don't have a Facebook or a X account


 Your new post is loading...
 Your new post is loading...
Your new post is loading...
The Pew U.S. Religious Landscape Study religion map diagrams which religions have the highest populations in each state. Via CT Blake 
|
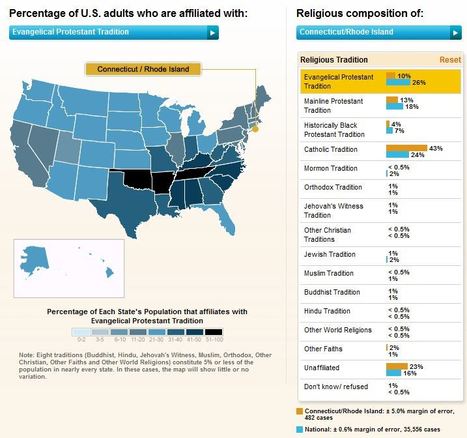
"The Pew survey sorts people into major groupings--Christians; other religions, including Jewish and Muslim; and 'unaffiliated,' which includes atheist, agnostic and 'nothing in particular.' Roll your cursor over the map to see how faiths and traditions break down by state."

Ignacio Quintana's curator insight,
December 1, 2014 6:56 PM
Even though this is just an info-graphic, this is very interesting. What we can see from this map is the spatial organization of religion specifically in the U.S. It's interesting to see how protestant makes up the majority (but apparently not according to the article above this from Haak's page) and how drastically these views can change from coast to coast, and state to state. What I find particularly interesting is that you can clearly find hearths of many of these religions, for example, Utah has an extremely out-numbering amount of Mormons. For obvious reasons that is, but still very educational to see the centers of many of the big religions in the United States. 
Joshua Mason's curator insight,
January 28, 2015 8:46 PM
Looking at the map, it looks like the Northeast is predominately Catholic while the further South you go along the Eastern coast, you find more Protestants, mostly Evangelical, especially in the from Confederate States. The Mid and Northwest seems to hold a healthy mix of all the Christian denominations while places in the Southwest have a higher Catholic percentage, my guess would be from immigration from Mexico. The one odd ball out in the Southwest is Utah with its 58% of Mormons. 
Molly McComb's curator insight,
March 21, 2015 4:04 PM
Different cultural religions and senses of place in America. This graph shows the diversity of religion around the united states as it varies from place to place. |


This shows how different religions have affected different states in the U.S. This affects certain areas in the states and their culture.
Khanh Fleshman's insight: This relates to Key Issue #1 because it shows the distribution of religions on a national scale. It also highlights the dominance of Christianity and Protestantism in the US.
Graham Shroyer's insight: This relates to key issue 1 because it shows the prevalence of christianity, a universalizing religion, in the US.
Vinay Penmetsa: This relates with the section, showing how Christianity is an universalizing religion, and its distribution in America.
Zahida Ashroff's Insight: This relates to Key Issue #1 because it shows the distribution and density of Protestants in the U.S. This map shows that the highest density of Protestants occur oin the South-Eastern region of the U.S.
Rishi Suresh: This relates to the distribution of denominations within America. It shows how the distribution is related to the patterns left by the original settlers.
Unit 3 culture
This diagram shows the percentage of adults by region to their corresponding religions. This demographic is part of America's major parts in its own branches. It shows highly developed religions like christianity and lower developed ones like Buddhism. This is an informative demographic.
This demographic relates to unit 3 because it shows how religions develop in different areas over time and pressures individual movements. It shows group organization throughout the u.s. and this is a cultural aspect of unit 3 that is very well touched upon. It is an overall demonstration of unit 3