IELTS, ESP, EAP and CALL
18.5K views | +0 today
Follow
IELTS, ESP, EAP and CALL
Interesting links and articles related to IELTS, ESP, EAP and E-learning.  Available to teach ESP, EAP, Research Skills, IELTS, TOEFL and General English.
Curated by Dot MacKenzie
Your new post is loading...
Scooped by Dot MacKenzie
Scoop.it!

Data Visualization | Precipitation Measurement Missions

Data Visualization | Precipitation Measurement Missions | IELTS, ESP, EAP and CALL | Scoop.it
Overview of the various tools for visualizing GPM data. ... The official website for NASA Precipitation Measurement Missions. These missions study rainfall and other types precipitation around the globe. The Global Precipitation Measurement (GPM) mission provides a new generation of satellite observations of rain and snow worldwide every three hours for scientific research and societal benefits.
No comment yet.
Scooped by Dot MacKenzie
Scoop.it!

Real Time Lightning Map

Real Time Lightning Map | IELTS, ESP, EAP and CALL | Scoop.it
See lightning strikes in real time across the planet. Free access to maps of former thunderstorms. By Blitzortung.org and contributors.
No comment yet.
Scooped by Dot MacKenzie
Scoop.it!

How UK's weather obsession obscures a proper understanding of key economic data

How UK's weather obsession obscures a proper understanding of key economic data | IELTS, ESP, EAP and CALL | Scoop.it
We have got stuck in a rut. Every month we explain away changes in retail spending with a lazy look to the skies.
No comment yet.
Scooped by Dot MacKenzie
Scoop.it!

How climate change is driving emigration from Central America

How climate change is driving emigration from Central America | IELTS, ESP, EAP and CALL | Scoop.it
Poverty and violence are often cited as the reasons people emigrate from Central America, but factors such as drought, exacerbated by climate change, are driving people to leave too.
No comment yet.
Scooped by Dot MacKenzie
Scoop.it!

earth :: a global map of wind, weather, and ocean conditions

earth :: a global map of wind, weather, and ocean conditions | IELTS, ESP, EAP and CALL | Scoop.it
See current wind, weather, ocean, and pollution conditions, as forecast by supercomputers, on an interactive animated map. Updated every three hours.
No comment yet.
Rescooped by Dot MacKenzie from green infographics
Scoop.it!

Living portrait of a storm – a live data visualization of Sandy

Living portrait of a storm – a live data visualization of Sandy | IELTS, ESP, EAP and CALL | Scoop.it

Sitting in London, our thoughts are with all those suffering the devastating effects of Storm Sandy in the US and elsewhere.

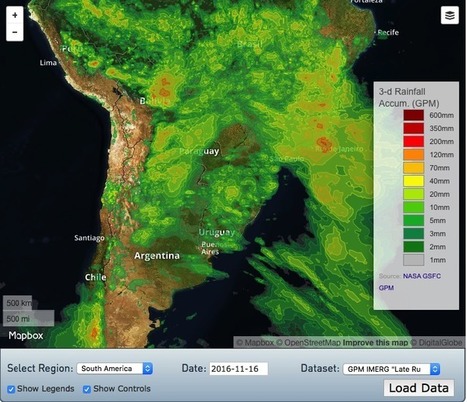
For those anxious to track its chaos, this fascinating live data visualisation created by Fernanda Vegas and Martin Wattenberg on HINT.FM represents the destructive force of nature in all its complexity. The Wind Map was created as a “living portrait of the wind currents over the U.S,” which artfully reflects the weather patterns and their emotional impact on our lives.


To find out more about the impact of Storm Sandy visit The New York Times microsite which assesses the damage with data visualisations alongside images of the impact taken at the worst-hit areas...


Via Lauren Moss
No comment yet.