


Animated global statistics that everyone can understand
Get Started for FREE
Sign up with Facebook Sign up with X
I don't have a Facebook or a X account


 Your new post is loading...
 Your new post is loading...
Your new post is loading...
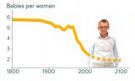
Animated global statistics that everyone can understand 
No comment yet.
Sign up to comment
![8 Types Of Infographics & Which One To Use When [Infographic] | Languages, ICT, education | Scoop.it](https://img.scoop.it/ciLGbLDaiuav6W1zNBv2mDl72eJkfbmt4t8yenImKBVvK0kTmF0xjctABnaLJIm9)
This visual presentation shows you the 8 types of infographics, and which one is the most effective to use depending on the content you are developing. Via Nik Peachey

PierrePilon's curator insight,
October 29, 2013 9:58 AM
Quelques bons indicateurs pour savoir quand et comment utiliser les infographiques. 
David Baker's curator insight,
October 29, 2013 5:48 PM
Selecting the correct type of format greatly increases effectiveness of content. THis is similar to helping students learn to write for audience and purpose. 
John O'Connor's curator insight,
March 19, 2014 8:47 AM
info graphics are something that I really want to develop more skills in. |

Does your data tell a story and can you visualize it? We look at the history and thought processes behind data visualization and successful infographics. Via Nik Peachey

Nik Peachey's curator insight,
December 26, 2017 1:35 AM
Worth thinking about in terms of how we use data in the classroom. 
Beatrice J. P. Vasconcelos's curator insight,
December 26, 2017 5:19 PM
Achei bem legal...vou exercitar...
|


