


Animated global statistics that everyone can understand
Get Started for FREE
Sign up with Facebook Sign up with X
I don't have a Facebook or a X account


 Your new post is loading...
 Your new post is loading...
Your new post is loading...
Animated global statistics that everyone can understand 
No comment yet.
Sign up to comment
![8 Types Of Infographics & Which One To Use When [Infographic] | Languages, ICT, education | Scoop.it](https://img.scoop.it/ciLGbLDaiuav6W1zNBv2mDl72eJkfbmt4t8yenImKBVvK0kTmF0xjctABnaLJIm9)
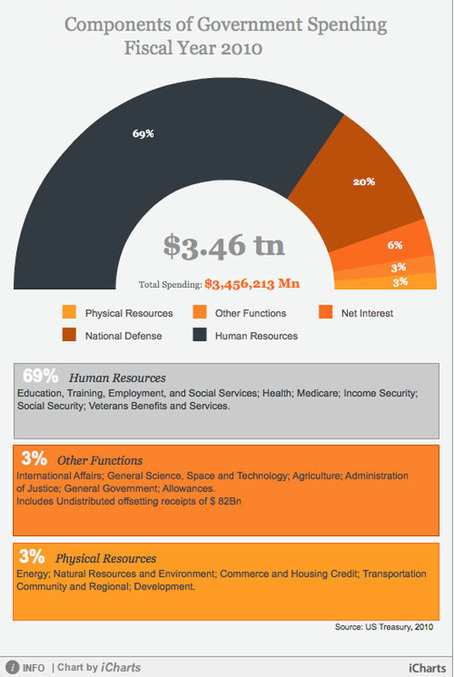
This visual presentation shows you the 8 types of infographics, and which one is the most effective to use depending on the content you are developing. Via Nik Peachey

PierrePilon's curator insight,
October 29, 2013 9:58 AM
Quelques bons indicateurs pour savoir quand et comment utiliser les infographiques. 
David Baker's curator insight,
October 29, 2013 5:48 PM
Selecting the correct type of format greatly increases effectiveness of content. THis is similar to helping students learn to write for audience and purpose. 
John O'Connor's curator insight,
March 19, 2014 8:47 AM
info graphics are something that I really want to develop more skills in. |

We live in a society of information overload with technological access at every corner and, more than ever, people complaining that they simply "just don't have the time." We are expected to filter the constant bombardment of mostly insignificant information, making it difficult to find out what is relevant, important, and crucial to our everyday lives. ... We are always looking for new tools to improve our learning, so let's meet the new kid taking the learning world by storm, infographics.
A picture is worth a thousand words, but creating cool infographics can be time-consuming. So we've found 20 amazing tools to make it easier.
|


