

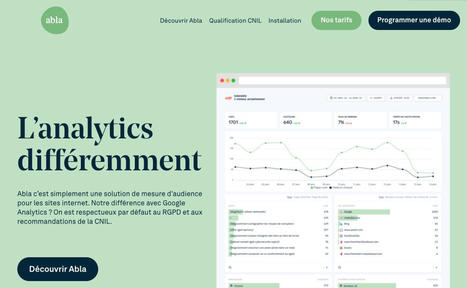

Abla Analytics est une bonne nouvelle. Celle de trouver enfin de quoi remplacer Google Analytics. Made in France, 100 % RGPD, CNI
Via Fidel NAVAMUEL
Get Started for FREE
Sign up with Facebook Sign up with X
I don't have a Facebook or a X account


 Your new post is loading...
 Your new post is loading...
Your new post is loading...
Abla Analytics est une bonne nouvelle. Celle de trouver enfin de quoi remplacer Google Analytics. Made in France, 100 % RGPD, CNI Via Fidel NAVAMUEL 
No comment yet.
Sign up to comment
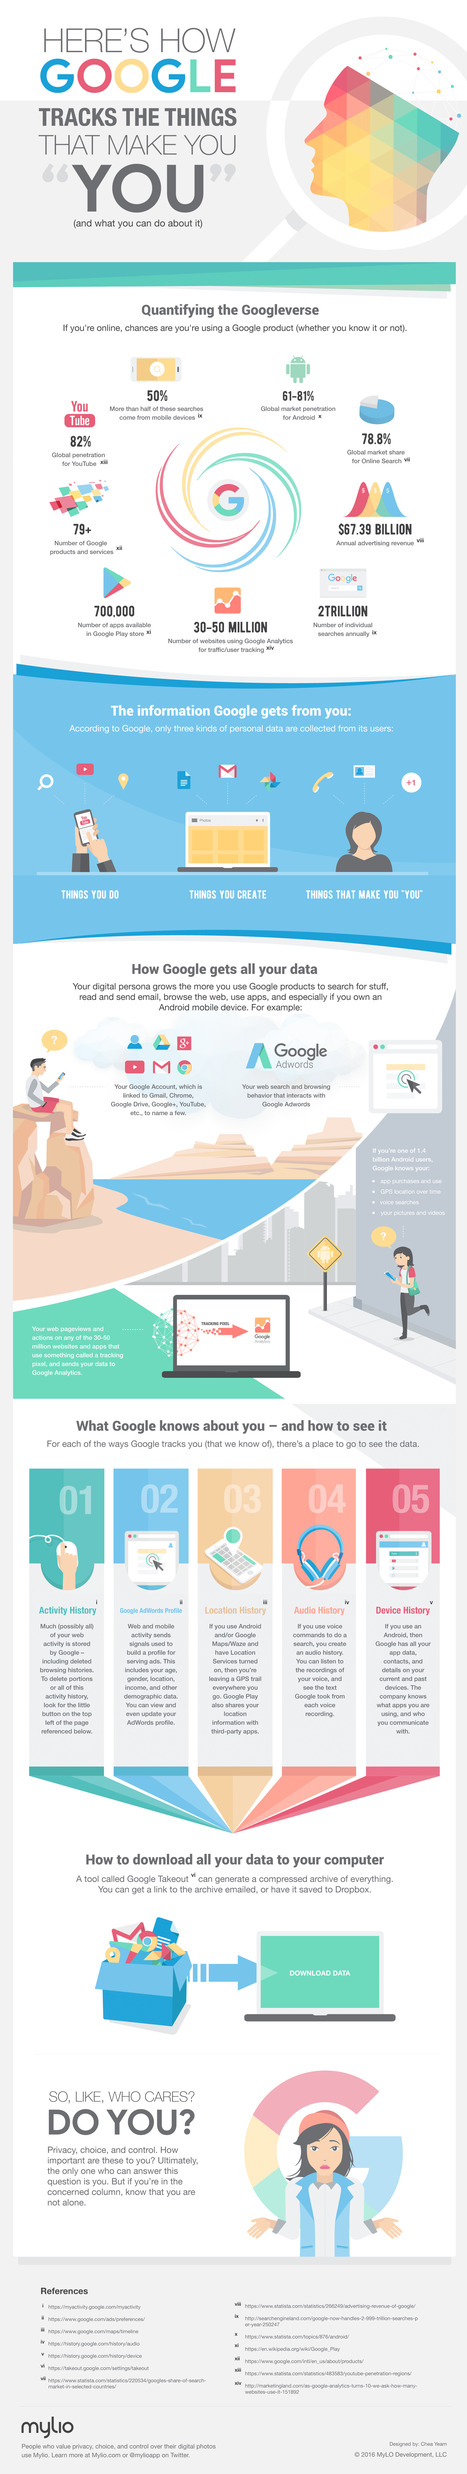
Just about anyone who's online is in some way interacting with a Google product. Here's how Google tracks you -- and what you can do about it. Via Peter Azzopardi, Jim Lerman, Evdokia Roka

Marcin Golczak 's curator insight,
December 21, 2019 11:53 AM
Prywatność i bezpieczeństwo danych (Yahoo!, Evernote, a Rosja, patrzymy na Ciebie) obejmuje się jako wielki temat na nadchodzący rok, więc myślimy
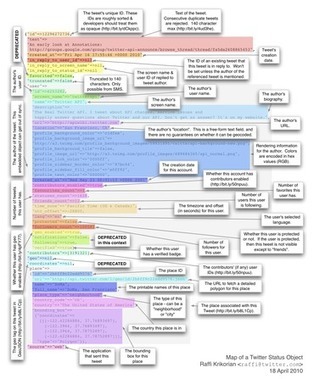
Just because you only see 140 characters doesn't mean that Twitter isn't getting complicated behind the scenes. Here's how status objects are evolving. Via luiy, juandoming

luiy's curator insight,
September 22, 2014 4:26 PM
.. an interesting map of what's going on behind your Twitter stream. As it turns out, there is quite a bit of data associated with not just you as a user, but also with every tweet that you post to the service.
Cette fonction activable via Google Docs affiche des statistiques aussi complètes qu’étonnantes sur l’utilisation de Gmail. Via ALEXANDRE Regis

Ce programme est de loin l’outil gratuit le plus complet disponible pour suivre les performances de votre site. Alors, oui, le nom est un peu difficile à orthographier, mais apprendre à utiliser Google analytic c’est la garantie de connaitre votre clientèle et de bâtir une stratégie webmarketing cohérente. Nous allons donc voir ensemble comment installer cet outil de statistiques google Via Frédéric DEBAILLEUL
|
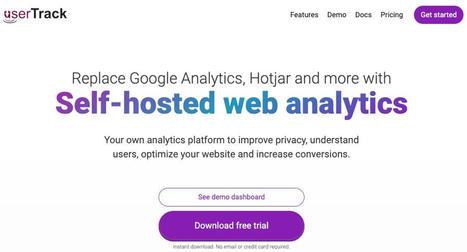
Usertrack fait partie des alternatives à Google Analytics en offrant des options d'analyse et de suivi de votre audience parmi les plus complètes. Via Fidel NAVAMUEL
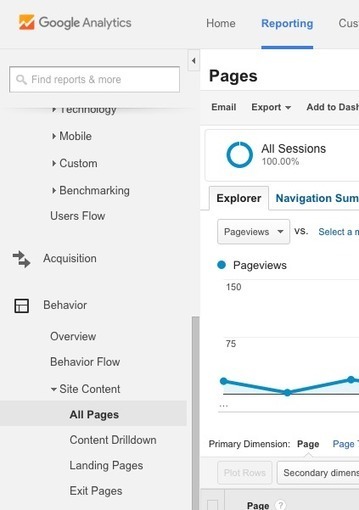
Here's how to use Google Analytics to find your most valuable content to highlight in your email marketing. Via massimo facchinetti
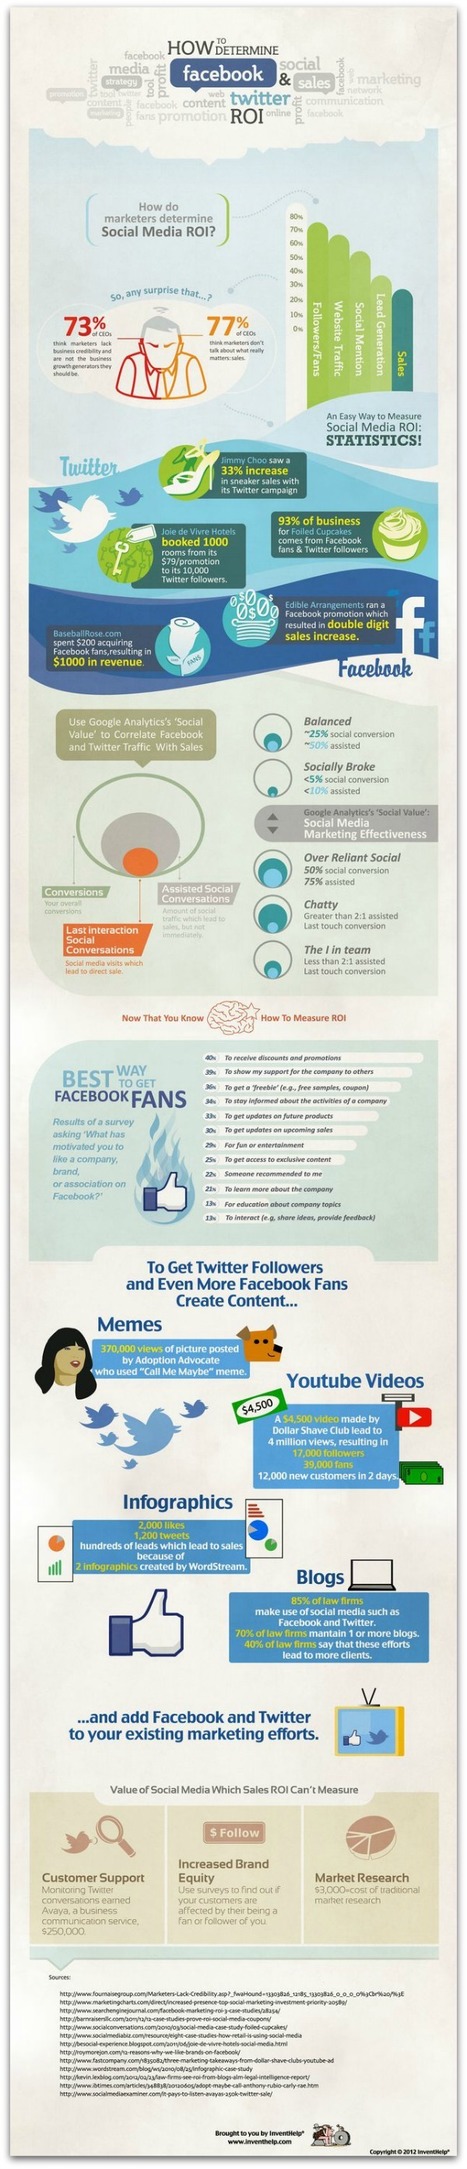
Seventy-three percent of CEOs think marketers lack business credibility and 77 percent believe marketers don't talk about what really matters—sales. If this sounds like your business or company, it's clearly time to find a way to measure the return on investment of all those hours dedicated to social media. This infographic has some tips and examples that can help and explains how to use statistics and analytics to determine and identify conversions, sales leads and potential leads...
Check out the graphic for more tips, as well as advice on how to grow your Facebook and Twitter fan base... Via Lauren Moss
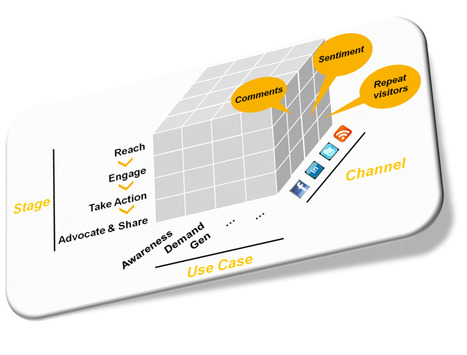
Last week I had the opportunity to present my views on social media analytics at Business Insider’s Social Media Analytics conference (you can view the slides from my presentation here). The lessons I presented were based on my own experience, both based on my work at SAP but also on discussions with my peers in the industry. They were centered around the following three key takeaways:
1. Differentiate, but be consistent Although this sounds like an oxymoron, defining a consistent social media analytics framework can help create a common vocabulary and allow you to learn by being able to consistently compare across your various campaigns. There are three key dimensions as shown on the chart above... Via Martin Gysler
![Twitter, Facebook, LinkedIn: How, When And Where Do People Socially Share? [INFOGRAPHIC] | information analyst | Scoop.it](https://img.scoop.it/i3FgAO73Fe4khzj0zgSfEzl72eJkfbmt4t8yenImKBVvK0kTmF0xjctABnaLJIm9)
Interesting statistics from Media Bistro
Key Takeaways -
*Twitter is the all-time champion of sharing, with growth of some 35,356% over the last five years, leading Facebook (5,809%) and LinkedIn (3,226%)
*Over the past year, Facebook’s Send button has seen growth of 756%, beating Tumblr (532%) and Google’s +1 button (418%)
*The peak hour for sharing each day is 9.30am EST (Wednesday is the peak day)
*Most users click 2 minutes after content is shared
*The bulk of sharing takes place via copy and paste
Curated by JanLGordon covering "Content Curation, Social Media & Beyond" Via janlgordon
|


