information analyst
43.8K views | +0 today
Follow
information analyst
km, ged / edms, workflow, collaboratif
Your new post is loading...
Rescooped by michel verstrepen from visual data
Scoop.it!

Interaction Design for Data Visualizations

Interaction Design for Data Visualizations | information analyst | Scoop.it
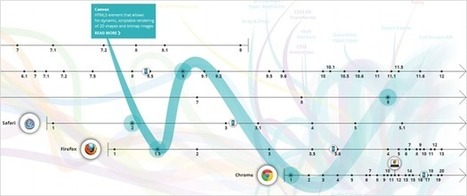
Interactive data visualizations are an exciting way to engage and inform large audiences. They enable users to focus on interesting parts and details, to customize the content and even the graphical form, and to explore large amounts of data. At their best, they facilitate a playful experience that is way more engaging than static infographics or videos.

Several ideas and concepts of interaction design for data visualizations are presented in this post, using 11 examples from the web. The overall concepts featured include:

The Basics: Highlighting and Details on Demand Making More Data Accessible: User-driven Content Selection Showing Data in Different Ways: Multiple Coordinated Visualizations Showing Data in Different Ways: User-driven Visual Mapping Changes Integrating Users’ Viewpoints and Opinions

Visit the complete article for numerous links, useful visuals and specific details on how to understand, implement and evaluate interactive design elements used in data visualization design.


Via Lauren Moss
Hans's comment, October 2, 2012 5:09 AM
Great article, I really like the idea of interactive information with details on demand. As an interaction designer I always try to balance content management and usability. Here are some interesting examples that made me consider a complete information surface vs a deep level on demand architecture.
JongWon Kim's comment, October 9, 2012 10:39 PM
really beautiful!!
Rescooped by michel verstrepen from Transmedia: Storytelling for the Digital Age
Scoop.it!

On the loss of control over the narrative. New roles on the interactive documentary (I)

On the loss of control over the narrative. New roles on the interactive documentary (I) | information analyst | Scoop.it

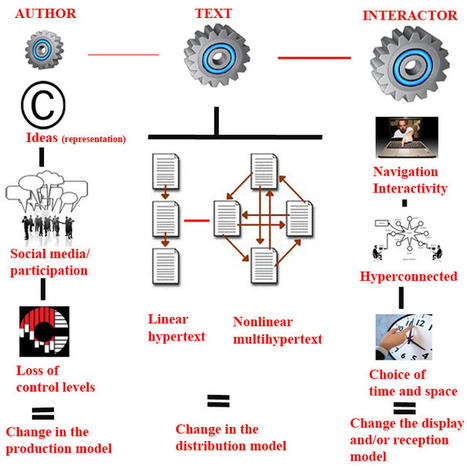
The intrinsic nature of the conventional documentary has experienced major changes since the advent of this new type of documentary, as a result of today’s new technological landscape.


Via The Digital Rocking Chair
No comment yet.
Rescooped by michel verstrepen from visual data
Scoop.it!

Telling Stories with Data – VisWeek 2011

Telling Stories with Data – VisWeek 2011 | information analyst | Scoop.it

"Data storytelling" is all the rage on websites ranging from international news outlets, to political and economic organizations, to personal blogs. Indeed, this trend has captured the attention of those who research and work in information visualization. Scores of both aspiring and seasoned visual storytellers descended on the Telling Stories with Data workshop that we organized this year to discuss and learn about visualization storytelling tools, issues, and contexts...


Via Lauren Moss
No comment yet.
Rescooped by michel verstrepen from Backpack Filmmaker
Scoop.it!

On the loss of control over the narrative. New roles on the interactive documentary (I)

On the loss of control over the narrative. New roles on the interactive documentary (I) | information analyst | Scoop.it

The intrinsic nature of the conventional documentary has experienced major changes since the advent of this new type of documentary, as a result of today’s new technological landscape.


Via The Digital Rocking Chair, Brad Tollefson
No comment yet.
Rescooped by michel verstrepen from Video for Learning
Scoop.it!

Grockit Answers

Grockit Answers | information analyst | Scoop.it

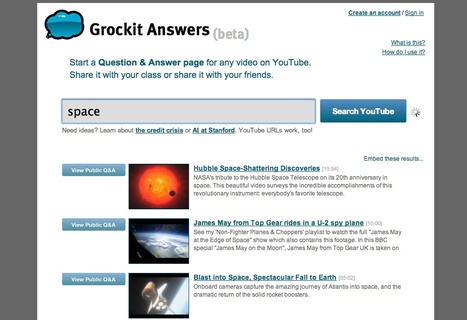
"Start a Question & Answer page for any video on YouTube"


Grockit Answers is very interesting tool, that allows one to initiate discussion around YouTube videos. It probabl;y needs a critical mass of users to get going so hope this post helps.


Via theo kuechel
No comment yet.