At the Visualized conference on November 9th, Neil Halloran posed an interesting question: Can DataViz lead to a data savvy society in the same way that the printing press lead to a literate one? One that is prepared to make tough decisions on complex issues?
Neil Halloran thinks so. That’s why he created VisualBudget.org to cut through hyperbole surrounding the what may be the most frequently misunderstood and pressing issue facing Americans today, our massive $16 trillion dollar deficit.
But how is a modern citizen supposed to make an informed decision on issues of tremendous scope and complexity, such as the fiscal cliff or the growing budget deficit without falling back on sound bites and punditry? Neil Halloran’s solution is to tell a story. Rather than simply presenting a static infographic or a set of tabular data on federal receipts and expenditures, VisualBudget.org takes you on a interactive tour...
Via
Lauren Moss


 Your new post is loading...

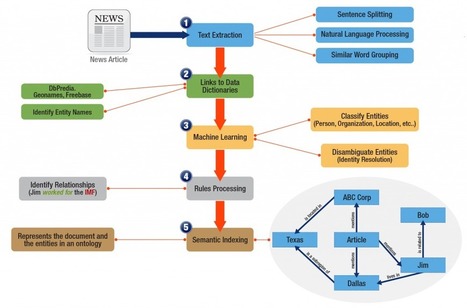


Semantic pipelines allow for the identification, extraction, classification and storage of semantic knowledge creating a knowledge base of all your data. Most organizations have struggled to create these pipelines primarily because the plumbing hasn't existed. But now it does.
This post discusses how free flowing text streams into graph databases using concept extraction processes. A well coordinated feed of data is written to the underlying graph database while updates are tracked on a continuous basis to ensure database integrity.
Other important pipeline plumbing includes tools for disambiguation (used to resolve the definition of entities inside the text), classification of the entities, structuring relationships between entities and determining sentiment.
Organizations that deploy well functioning semantic pipelines have an added advantage over their competitors. They have instant access to a completed knowledge base of data. Research functions spend less time searching and more time analyzing. Alerting notifies critical business functions to take immediate action. Service levels are improved using accurate, well structured responses. Sentiment is detected allowing more time to react to changing market conditions.
In general, the REST Client API calls out a GATE-based annotation pipeline and sends back enriched data in RDF form. Organizations typically customize these pipelines which consist of any GATE-developed set of text mining algorithms for scoring, machine learning, disambiguation or any of the other wide range of text mining techniques.
It is important to note that these text mining pipelines create RDF in a linear fashion and feed GraphDB™. Once the RDF is enriched in this fashion and stored in the database, these annotations can then be modified, edited or removed. This is particularly useful when integrating with Linked Open Data (LOD) sources. Updates to the database are populated automatically when the source information changes.
For example, let’s say your text mining pipeline is referencing Freebase as its Linked Open Data source for organization names. If an organization name changes or a new subsidiary is announced in Freebase, this information will be updated as reference-able metadata in GraphDB™.
In addition, this tightly-coupled integration includes a suite of enterprise-grade APIs, the core of which is the Concept Extraction API. This API consists of a Coordinator and Entity Update Feed. Here’s what they do:
Other APIs include Document Classification, Disambiguation, Machine Learning, Sentiment Analysis & Relation Extraction. Together, this complete set of technology allows for tight integration and accurate processing of text while efficiently storing resulting RDF statements in GraphDB™.
As mentioned, the value of this tightly-coupled integration is in the rich metadata and relationships which can now be derived from the underlying RDF database. It’s this metadata that powers high performance search and discovery or website applications – results are compete, accurate and instantaneous.
- See more at: http://www.ontotext.com/text-mining-triplestores-full-semantic-circle/#sthash.fg1RVcQN.dpufIn general, the REST Client API calls out a GATE-based annotation pipeline and sends back enriched data in RDF form. Organizations typically customize these pipelines which consist of any GATE-developed set of text mining algorithms for scoring, machine learning, disambiguation or any of the other wide range of text mining techniques.
It is important to note that these text mining pipelines create RDF in a linear fashion and feed GraphDB™. Once the RDF is enriched in this fashion and stored in the database, these annotations can then be modified, edited or removed. This is particularly useful when integrating with Linked Open Data (LOD) sources. Updates to the database are populated automatically when the source information changes.
For example, let’s say your text mining pipeline is referencing Freebase as its Linked Open Data source for organization names. If an organization name changes or a new subsidiary is announced in Freebase, this information will be updated as reference-able metadata in GraphDB™.
In addition, this tightly-coupled integration includes a suite of enterprise-grade APIs, the core of which is the Concept Extraction API. This API consists of a Coordinator and Entity Update Feed. Here’s what they do:
Other APIs include Document Classification, Disambiguation, Machine Learning, Sentiment Analysis & Relation Extraction. Together, this complete set of technology allows for tight integration and accurate processing of text while efficiently storing resulting RDF statements in GraphDB™.
As mentioned, the value of this tightly-coupled integration is in the rich metadata and relationships which can now be derived from the underlying RDF database. It’s this metadata that powers high performance search and discovery or website applications – results are compete, accurate and instantaneous.
- See more at: http://www.ontotext.com/text-mining-triplestores-full-semantic-circle/#sthash.fg1RVcQN.dpuf