

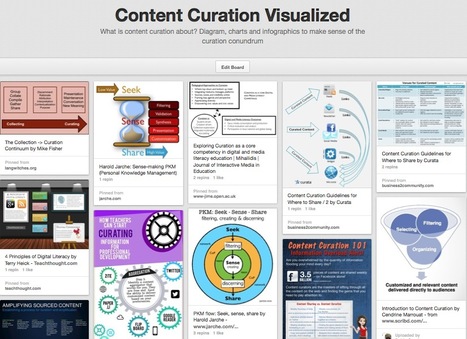

What is content curation about? Diagram, charts and infographics to make sense of the curation conundrum
Via Robin Good, Manuel Pinto
Get Started for FREE
Sign up with Facebook Sign up with X
I don't have a Facebook or a X account


 Your new post is loading...
 Your new post is loading...
Your new post is loading...
What is content curation about? Diagram, charts and infographics to make sense of the curation conundrum Via Robin Good, Manuel Pinto 

Gliffy.com is a web-based diagram editor. Create and share flowcharts, network diagrams, floor plans, user interface designs and other drawings online. Via Baiba Svenca
|
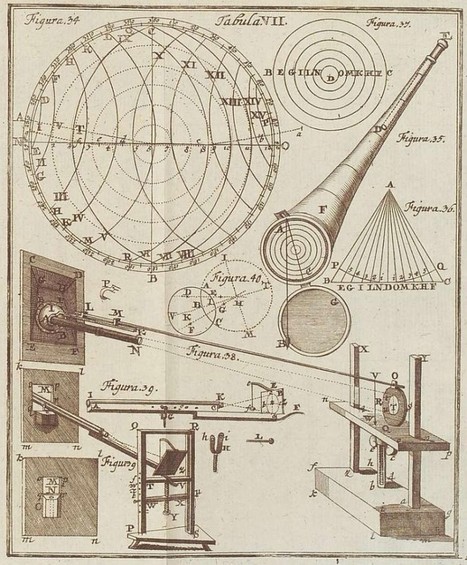
Graphics, charts, diagrams and visual data representations have been published on books, newspapers and magazines since they've existed, not to mention old maps and scientific illustrations...
Despite the lack of tools such as the ones we have at our disposal nowadays, they are as inspiring and important as the best contemporary visualizations. Visit the article link for a gallery of vintage visualizations... Via Lauren Moss, Bucky Dodd

Charlley Luz's curator insight,
July 20, 2013 10:26 AM
muito legal, os Infográficos antes de existir a internet. 35 exemplos de infográficos no papel :) Achei falta do Marcha para Moscou do Minard http://www.datavis.ca/gallery/re-minard.php ; 
Leoncio Lopez-Ocon's curator insight,
July 20, 2013 2:57 PM
El brasileño Tiago Veloso, fundador de Visual Loop, nos ofrece 35 interesantísimas representaciones visuales de distintos fenómenos y eventos que permiten hacer un paseo por la historia de la ilustración científica. |


Curate using this visual map
This will be helpful to share to those wondering about content curation.
Valuable collection of the art of curation from Robin Good.