information analyst
43.8K views | +0 today
Follow
information analyst
km, ged / edms, workflow, collaboratif
Your new post is loading...
Rescooped by michel verstrepen from iGeneration - 21st Century Education (Pedagogy & Digital Innovation)
Scoop.it!

The Grandparent’s Guide to the Internet [INFOGRAPHIC]

The Grandparent’s Guide to the Internet [INFOGRAPHIC] | information analyst | Scoop.it
You don’t have to leave the internet to the young. And the truth is that fewer and fewer older people do. The internet is not hard to learn, and most people find that once they take the dive, they really enjoy it. What’s more, before long, you might be teaching your grandson a thing or two.

Via Tom D'Amico (@TDOttawa)
No comment yet.
Rescooped by michel verstrepen from digital marketing strategy
Scoop.it!

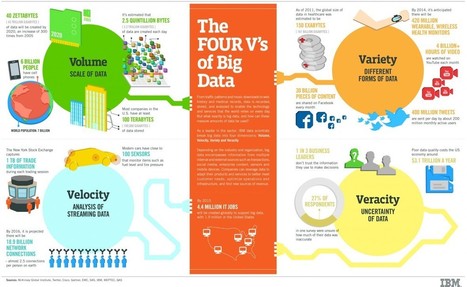
The Four V's of Big Data | Infographic

The Four V's of Big Data | Infographic | information analyst | Scoop.it

BM data scientists break big data into four dimensions: volume, variety, velocity and veracity.


Via Tobias Frydman, Gust MEES, malek
Gust MEES's curator insight, February 8, 2016 11:53 AM

IBM data scientists break big data into four dimensions: volume, variety, velocity and veracity.


Learn more / En savoir plus / Mehr erfahren:


http://www.scoop.it/t/21st-century-learning-and-teaching/?tag=Big+Data...


Rescooped by michel verstrepen from Education 2.0 & 3.0
Scoop.it!

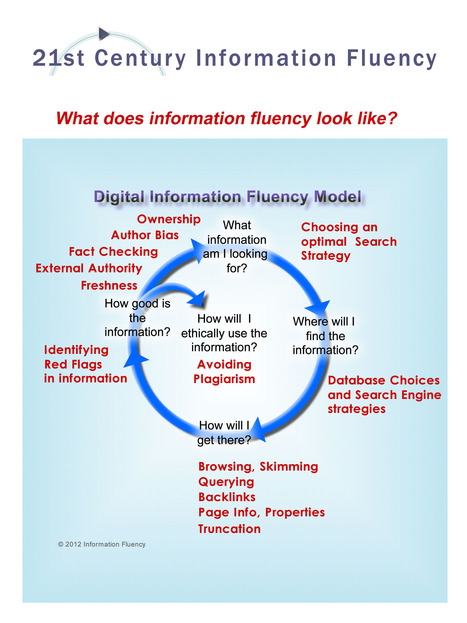
The Keyword Blog: Information Fluency Interactive Infographic

The Keyword Blog: Information Fluency Interactive Infographic | information analyst | Scoop.it

Via Yashy Tohsaku
Steve Whitmore's curator insight, August 14, 2015 8:05 AM

This is a great infographic for showing the thought process of finding information.

Terry Yelmene's curator insight, August 16, 2015 11:50 AM

A pretty well-reasoned, fundamental thought process for most knowledge work research.  This serves as an even better backward (there-to-here) model to guide the core research workflow process automation  a knowledge worker may want to devise, install.  Think work product-informed -> DevonThink structures -> DevonAgent w/'Active Filtered' automated searches.  The most important drivers here are - 'ethical' - (more than just multiple sources, a stage needs to be added at the work product stage to provide authenticity) and - 'bias' -  (a post automated search,  subsequent manual search for corroborating items selection to provide authority).

corroborating

Shannon Hearne's curator insight, June 5, 2018 3:22 PM
Share your insight
Rescooped by michel verstrepen from Technology and Education Resources
Scoop.it!

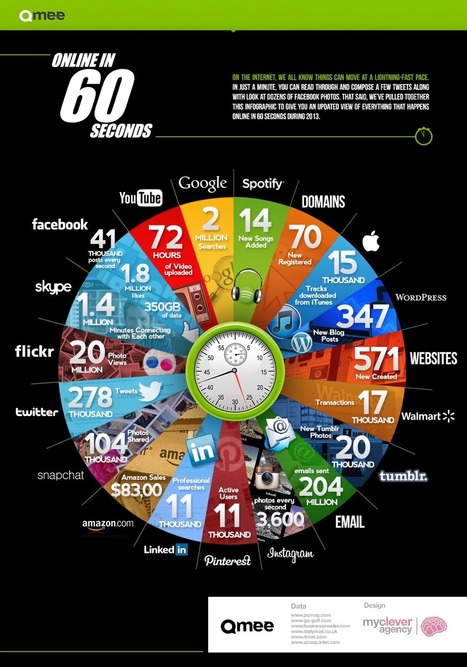
Qmee find out what happens online in 60 seconds

Qmee find out what happens online in 60 seconds | information analyst | Scoop.it

Via Beth Dichter, R.Conrath, Ed.D.
Viljenka Savli (http://www2.arnes.si/~sopvsavl/)'s curator insight, April 15, 2014 9:58 AM

This is what life today looks like :). The statistic is incredible and the distances ar

José Antônio Carlos - O Professor Pepe's curator insight, April 15, 2014 11:28 AM

A velocidade de nossos dias em um simples gráfico.

Nicky Mohan's curator insight, April 15, 2014 8:23 PM

All in just 60 seconds

Rescooped by michel verstrepen from visualizing social media
Scoop.it!

INFOGRAPHIC: The risk of posting in social networks

INFOGRAPHIC: The risk of posting in social networks | information analyst | Scoop.it
INFOGRAPHIC: The risk of posting in social networks. You have the right to remain private. Anything you post can and will be used against you.

Via Lauren Moss
Marissa Sharbell's curator insight, February 26, 2014 6:33 PM

This helpful infographic displays what can go wrong if you post the wrong content online. It warns about backlash that can happen without monitoring carefully what information is shared online. This advice can apply both professionally and personally, since every one who is online has potential risks when they put themselves out there.

Gloria Ross Musgrove's curator insight, March 2, 2014 4:28 PM

Investigating and bringing into laws different Cyber crimes.

Kaitlyn Kaminski's curator insight, March 13, 2014 5:13 PM

Something that students should know.

Rescooped by michel verstrepen from visualizing social media
Scoop.it!

Scoop.It for SEO – A New World of Curation [Infographic]

Scoop.It for SEO – A New World of Curation [Infographic] | information analyst | Scoop.it

For almost everyone who is a part of the online world coming up with fresh content consistently is a big challenge. Practically every guideline advises that content should be engaging, informative and relevant every single time. Consequently, content curation has taken off in a big way.

Simply put, content curation is the process of curating relevant and interesting content from various sources on the web and putting them together and publishing them on a personal site or blog. As a result of the popularity of the content curation process, a number of content marketing tools have been introduced. These tools are meant to help in the process of content marketing and SEO and facilitate the process of curation...


Via Lauren Moss
Dillon Thomas's curator insight, February 1, 2014 5:55 PM

SCOOPS --  I began using Scoop when I was defining myself a LITE FEET DANCER.  There was no single source of info about Lite Feet dance, a NYC Born Battle dance phenom and YouTube Sensation.  I created LITE FEET SCOOP TO reference for my own resume but also to provide anyone interested a link to the multitude of YOUTUBE Channels, Sound Cloud and personal sites dedicated to this unique art form and the talented dancers who participate. 


Annie 's curator insight, December 5, 2014 8:18 PM

Scoop.it helps with the process of curating content. This is a must for your social media.

Rescooped by michel verstrepen from visual data
Scoop.it!

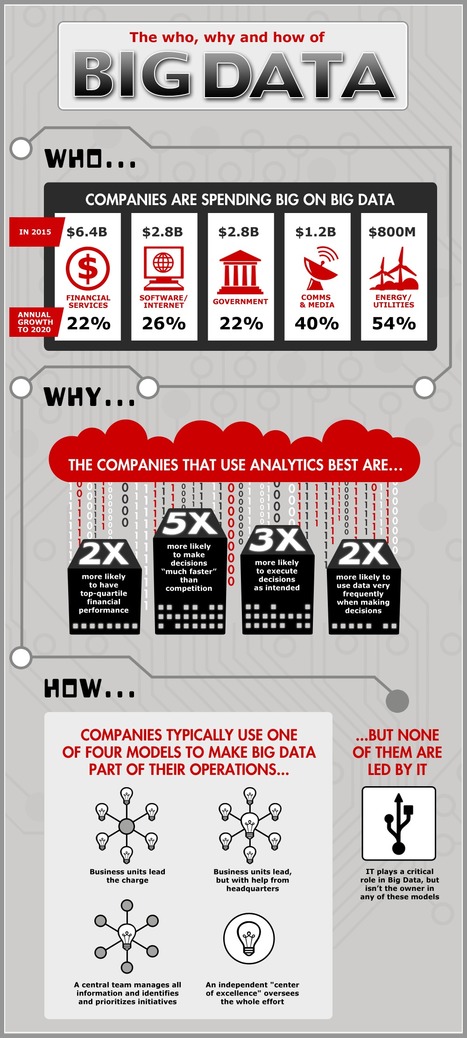
Infographic: The Who, Why And How Of Big Data

Infographic: The Who, Why And How Of Big Data | information analyst | Scoop.it

Early adopters of Big Data are outperforming competitors. To catch up, other companies need the right people and tools—but they also need to embed Big Data in their organizations. That means spelling out their ambitions, developing analytics skills and mindsets throughout the company, and creating an organizational home for the new Big Data capability.

Here’s how Big Data is taking shape at major companies today.


Via Lauren Moss
No comment yet.
Rescooped by michel verstrepen from Eclectic Technology
Scoop.it!

Manners Matter Online (Infographic)

Manners Matter Online  (Infographic) | information analyst | Scoop.it
Find out more about the do's and don'ts on online manners. For more information about internet issues visit Knowthenet today.

Via Beth Dichter
Tan Yang Fern's curator insight, August 23, 2013 7:45 AM

For cyberwellness

Cindy Powell's curator insight, April 10, 2014 2:09 PM

From Infographic...and Informational Text TCC 4-5

This is a graphic example for the article, but the site is a cybersafety site in the UK and has lots of information for parents about online safety for their children. It also tests their knowledge.

Rachael Johnston's curator insight, October 20, 2014 10:53 PM

It is important to build your own brand and to promote yourself positively. You want to be polite to other users and make sure you have nothing on your profile that could be damaging to your reputation. This includes swear words, inappropriate or rude comments, and pictures and videos of drinking or drugs.  This is really important for graduating students who, most likely, need to go through and delete pictures that have been tagged in one Facebook

Make sure you give credit to others if you share something of theirs. Also make sure you are writing your own posts and not just sharing others. However, make sure you are posting valuable and relevant information. Listen and think before you write and make sure you are using proper english. 

It is okay to have debates on social netowrks with other users, everybody has the right ti voice their opinion, but don't let things get too personal or nasty. 

It is also essential to understand that there are also hings to be very careful of when using social networks. For one, people are not always who they seem. You should also make sure you do not assume a false identity. It is important to keep some kind of professionalism, but don't change yourself or hide who you really are. 

You must also make sure you are abiding by the rules of the network and report others who dont. 

Last but certainly not least, be very careful about who you share things with. There are certain places to share certain things. For example, you may post something bout your personal life in your Facebook status, but it is not appropriate to do so on your LinkedIn profile. Do not share pictures and videos with strangers, you never know how they will use these. 


Scooped by michel verstrepen
Scoop.it!

The impact of social media on society (infographic)

The impact of social media on society (infographic) | information analyst | Scoop.it
Social media has reshaped the way we see the world and communicate with people around us. Want proof? Check out this great infographic created by MyLife. Source: MyLife Explore more infographics li...
Val&co's curator insight, July 30, 2013 4:17 AM

Excellente infographie ! merci !

Antonia Rudenstine's curator insight, July 30, 2013 8:50 AM

If this is how powerful social media is...how can districts continue to ban it from schools? In thinking about school design, social media is essential to leverage.

Denise McManus's curator insight, July 30, 2013 10:52 AM

If you're not on Social Media by now, read this!

Rescooped by michel verstrepen from 21st Century Learning and Teaching
Scoop.it!

How To Create A Perfect Tweet [INFOGRAPHIC]

How To Create A Perfect Tweet [INFOGRAPHIC] | information analyst | Scoop.it
Much has been written about how to write the perfect tweet, from what link shortener to use to how many characters to leave room for retweets.
Now the folks at Neomobile have tried their hand at creating a guide to composing the perfect tweet.

Via Brian Yanish - MarketingHits.com, Gust MEES
Pyramid Point Acct.'s curator insight, March 9, 2015 8:44 AM

how to write a best tweet....

Martin (Marty) Smith's curator insight, March 13, 2015 7:58 AM

Great Brian Yanish share (as always).

Tamasa Nelson's curator insight, March 16, 2015 10:49 PM

Info graphics are a great way to assemble and distribute information, especially data in one document. Teachers can request their students to compile data and create a visual to share quantifiable information.

Rescooped by michel verstrepen from Knowledge for Entrepreneurs
Scoop.it!

How Thieves Use Social Media To Rob You

How Thieves Use Social Media To Rob You | information analyst | Scoop.it
Thinking of tweeting about an upcoming holiday? Don’t. Thinking of sharing a photo of your latest grand purchase? Don’t. Thinking of checking in at the airport before your vacation? Don’t.

Via Gust MEES, ABroaderView, Dolly Bhasin
Jhonathan Garcia's curator insight, July 10, 2013 9:33 PM

Social Media Security Post:  Be careful with all the things you post!

Michelle Gilstrap's curator insight, July 11, 2013 1:13 PM

Never show photos of your vacation while you are on vacation. Always show photos when you get back home.

Carmenne Kalyaniwala's curator insight, October 15, 2013 2:36 AM

An infographic with some important information we can share with students

Rescooped by michel verstrepen from visualizing social media
Scoop.it!

Reseach Shows Social Media Hugely Important in SEO Ranking [INFOGRAPHIC]

Reseach Shows Social Media Hugely Important in SEO Ranking [INFOGRAPHIC] | information analyst | Scoop.it

Seven of the ten most important factors in SEO ranking now come from social media.


An updated study from Searchmetrics has revealed just how important social media signals are to a strong SEO ranking, with well-positioned URLs almost always having a high number of likes, shares, tweets and +1s.


Searchmetrics have documented their findings in this infographic, which takes a closer look at what well-positioned web pages on Google have in common, and what distinguishes them from pages that are lower-ranked.


Via Lauren Moss
Panovus's curator insight, July 1, 2013 4:05 AM

Do you reach your audience via Social Media?Panovus know what works best.Learn more:http://goo.gl/krpHx

Andy Birkitt's curator insight, July 26, 2013 7:20 AM

A recent study by Searchmetrics has revealed just how important social media signals are to a strong SEO ranking and then produced the results as this really nice infographic.

Rescooped by michel verstrepen from An Eye on New Media
Scoop.it!

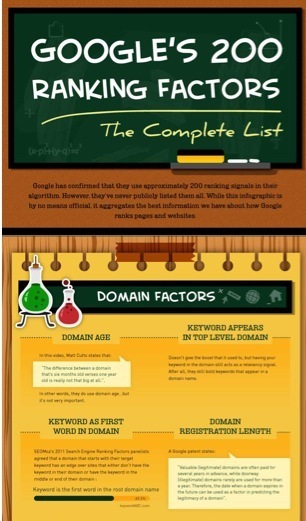
200 SEO TIPS (Infographic)

200 SEO TIPS  (Infographic) | information analyst | Scoop.it

Many quick tips to improve your site's SEO (infographic)

---
SEO itself has always been somewhat of a barrier to entry for online success. In other words, for a new person it's so complex that it takes a long time to


Via Robin Good, Ken Dickens, Ken Morrison
Ahmed Lizzaik's curator insight, July 12, 2013 6:23 AM

Excellent

Lynn O'Connell for O'Connell Meier's curator insight, September 14, 2013 12:41 AM

From May 2013, so some things may have changed...


Maggie DeGennaro's comment, September 15, 2013 12:37 PM
Great information...
Rescooped by michel verstrepen from ICT Security-Sécurité PC et Internet
Scoop.it!

EU GDPR Infographic: What the new Regulation means in 1 minute – IT Governance Blog | #Privacy #EU #laws

EU GDPR Infographic: What the new Regulation means in 1 minute – IT Governance Blog | #Privacy #EU #laws | information analyst | Scoop.it
If your organisation does business within the European Union or collects data on European citizens you’ve likely been told about the newly approved EU General Data Protection Regulation (GDPR), which will come into force in spring 2018.

The GDPR will increase privacy for individuals and give regulatory authorities greater powers to take action against businesses that breach the law.

Are you prepared to take the steps necessary for compliance? Here’s a brief overview of everything you need to know about the new Regulation and what it means for your business.


Learn more / En savoir plus / Mehr erfahren:


https://gustmees.wordpress.com/2013/12/21/privacy-in-the-digital-world-shouldnt-we-talk-about-it/


Via Gust MEES
Gust MEES's curator insight, May 10, 2016 1:54 PM
If your organisation does business within the European Union or collects data on European citizens you’ve likely been told about the newly approved EU General Data Protection Regulation (GDPR), which will come into force in spring 2018.

The GDPR will increase privacy for individuals and give regulatory authorities greater powers to take action against businesses that breach the law.

Are you prepared to take the steps necessary for compliance? Here’s a brief overview of everything you need to know about the new Regulation and what it means for your business.


Learn more / En savoir plus / Mehr erfahren:


https://gustmees.wordpress.com/2013/12/21/privacy-in-the-digital-world-shouldnt-we-talk-about-it/


Bruillon's curator insight, May 23, 2016 1:52 PM
Nouvelle réglementation sur PDP
Scooped by michel verstrepen
Scoop.it!

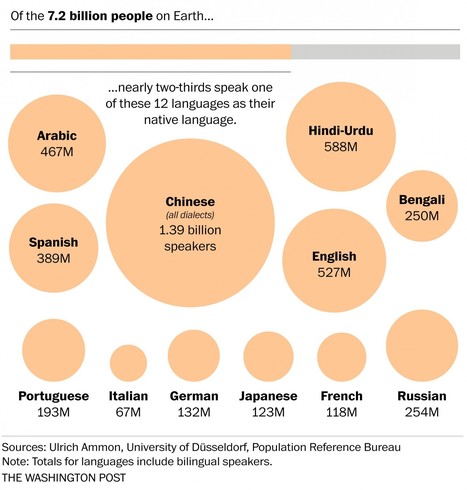
The world’s languages, in 7 maps and charts

The world’s languages, in 7 maps and charts | information analyst | Scoop.it

"These seven maps and charts, visualized by The Washington Post, will help you understand how diverse other parts of the world are in terms of languages."


Tags: language, culture, infographic.

Caitlyn Christiansen's curator insight, May 26, 2015 10:35 AM

The world is extremely diverse in its spread of native languages. Yet only a handful are commonly spoken by the majority of the world, about 2/3. Over half of the world's languages are expected to go extinct because of the extreme diversity and the minimal distribution which means that in some places almost every person speaks a completely different language and many are dying as their last speakers do not pass it on to their children.


This article is relates to cultural patterns and processes through the geographic spread of languages around the globe and the increasing acculturation that causes the loss of many of these languages in our increasingly globalized world.

Michael Amberg's curator insight, May 26, 2015 10:35 PM

Its interesting to see just how many people speak the languages we speak everyday, and to see just how many people DONT speak it.

Shane C Cook's curator insight, May 27, 2015 5:34 AM

It is amazing to see all main languages in perspective to the world. Mandarine holding the top spot with 1.39 Billion surprises me but at the same time doesn't. There are 1.3 billion people living there in the first place.

Rescooped by michel verstrepen from visualizing social media
Scoop.it!

46 Hidden Tips and Tricks to Use Google Search Like a Boss: Infographic

46 Hidden Tips and Tricks to Use Google Search Like a Boss: Infographic | information analyst | Scoop.it

How often do you use Google to find something on the internet?

If like a lot of people you use Google every day you’ll be astounded by the number of hidden tips and tricks their search facility offers.

Find 46 of them featured in this infographic.


Via Lauren Moss
Mayra.Loves.Books's curator insight, January 9, 2015 10:38 AM

More Google search tips...

Kelly 's curator insight, January 9, 2015 10:46 AM

Nothing hidden about these "tips & tricks" - just standard every day library functions. This is not new, most these functions have been used since Win95, the days before we see the net as we do now. Nonetheless, whatever it takes for people to finally catch up and educate themselves about easier searching techniques! 

Teresa Maceira's curator insight, April 8, 2016 8:32 PM
Add Google hacks to a students research skill set
Rescooped by michel verstrepen from visualizing social media
Scoop.it!

How Social Media Changed the Way We Consume News [Infographic]

How Social Media Changed the Way We Consume News [Infographic] | information analyst | Scoop.it

Social media is fast becoming one of the main destinations for news online. An infographic created by the University of Florida Online, explores the evolution of the news industry and the way news is consumed.

In 2012 there were 2.4 billion Internet users, and 1.4 billion of them were using social media. Nearly 50 percent of Internet users surveyed said they regularly or occasionally heard about a breaking story on social media before it broke on mainstream sources. In fact, since 2009, social media buzz has resulted in a 57 percent increase in traffic to news sites.

Now online dominates the news market, with 64.5 percent of people going to official sites like The New York Times to get their news. Surprisingly, nearly 30 percent of people still get their news from the papers, but social media is hot on print’s heels with 27.7 percent of consumers.

Find more details at the link.


Via Lauren Moss
BlairEvanBall's curator insight, February 21, 2014 4:38 PM

Social Media is closing in on print media as consumers choice for news. Online news has exploded, and is probably one of the reasons why Facebook continues to push NEWS in their news feed.

We as consumers seem to be hungry for news as it happens, and Social Media plays a big role in the delivery of content.

Mr Tozzo's curator insight, February 26, 2014 4:12 AM
How Social Media Changed the Way We Consume News [Infographic]
Sara Prendergast's curator insight, March 6, 2014 10:00 PM

Social media is incredibly important for the exchange of news. This infographic shows the evolution of news in social media, and what made it the important source of information it is today.

Rescooped by michel verstrepen from Curation Revolution
Scoop.it!

Is Social Media Making Us Narcissistic? [infographic]

Is Social Media Making Us Narcissistic? [infographic] | information analyst | Scoop.it
Social Media & Narcissism [INFOGRAPHIC] #socialmedia

Via Martin (Marty) Smith
Amy Williamson's curator insight, February 5, 2014 5:08 AM

A fascinating infographic, are you guilty of any of the things mentioned?

Alexander Abramov's curator insight, March 22, 2014 8:23 PM

add your insight...

   
Kelly Saiz's curator insight, April 15, 2014 8:29 AM

This is a question that I have wondered about. While this graphic gives an abbreviated, visual response to the question, it provides key insights into the issue. 


The image cleverly illustrates the signs of narcissism before depicting the negative effects of social media, which include ADHD, depression and narcissistic personality disorder and addiction, among others. 


It would be interesting to know the reasons WHY "People who use Facebook the most tend to have more narcissistic or insecure personalities" and why "those who [score] higher in narcissism also posted more often on twitter". While this post points out yet another important issue surrounding social media that cannot be ignored by business professionals and users alike, it does not provide enough information for the reasoning behind its statements. 

Rescooped by michel verstrepen from ICT Security-Sécurité PC et Internet
Scoop.it!

What happens after a data breach? [Infographic]

What happens after a data breach? [Infographic] | information analyst | Scoop.it
High profile data breaches that expose customer information are in the news. This graphic shows how the thieves sell the info and make their money.

Via Gust MEES
Rescooped by michel verstrepen from visualizing social media
Scoop.it!

Infographic: The Incredible Growth of Web Usage [1984-2013]

Infographic: The Incredible Growth of Web Usage [1984-2013] | information analyst | Scoop.it

In the three decades since the Internet evolved from an experimental band of academic and government computer systems into a globe-spanning network of interconnected systems, the amount of time spent online has grown to rival (or even exceed) the time spent living offline. Personal computers, tablets and smartphones have made the connected life a reality, and the number of folks pursuing it has exploded.


Find more details at the link.


Via Lauren Moss
Andrew Earnshaw's curator insight, September 20, 2013 3:23 PM

Yes, I too can remember when there wasn't an Internet. Is there an application that's not yet been produced. What next will we all wonder how we did without ?

Al Marqz's curator insight, September 27, 2013 7:14 PM

La humanidad en bloque ha optado por la gran Red y de ésta, por las redes sociales... ¡Larga vida a la web!

Pallab Kakoti's curator insight, April 16, 2014 7:44 AM

The rise & rise of web usage is one of the most unifying & reformative development to have impacted on a global scale. An insightful info-graphic that offers a unique purview from the inception days of internet to the latest trend of app usage estimating an annual revenue of $24 billion.


A pure delight that's not to be missed #PlbKkt for #hshdsh via #blogs4bytes //

Rescooped by michel verstrepen from visualizing social media
Scoop.it!

Get The Most Out Of Social Media | Infographic

Get The Most Out Of Social Media | Infographic | information analyst | Scoop.it

The aim of social media is to facilitate brand awareness and develop your brand's personality. To do this you need to enter into meaningful conversations with your would-be customers, but before you can hold meaningful conversations you need to produce content that engages your followers.

This infographic provides you with 10 tips that will allow you to get the most out of your social media investment.


Via Lauren Moss
irfanahmad1989's comment, August 16, 2013 9:53 AM
Thank you Lauren Moss for sharing this.
Betty Carlin's curator insight, August 16, 2013 5:38 PM

10 tips to get the most our out your social media investment. [INFOGRAPHIC]

Bart van Maanen's curator insight, August 20, 2013 5:44 AM

Wat kun je waar het beste delen? Deze infographic helpt je dat te bepalen. Best opmerkelijk is dat Pinterest hier slecht scoort voor het delen van video's. 

Rescooped by michel verstrepen from 21st Century Learning and Teaching
Scoop.it!

Do You Know Who’s Watching You? [INFOGRAPHIC]

Do You Know Who’s Watching You? [INFOGRAPHIC] | information analyst | Scoop.it
Do You Know Who’s Watching You?: INFOGRAPHIC

Via Gust MEES
Rescooped by michel verstrepen from SocialMedia_me
Scoop.it!

This Is What Happens In Social Media In A Day In 2013 [Infographic]

This Is What Happens In Social Media In A Day In 2013 [Infographic] | information analyst | Scoop.it

The progression of social networking has created some mind blowing statistics and metrics when it comes to what goes on within social media in a day.


This infographic, Social Media In A Day, contains statistics and metrics from 10 different popular social networking services, presented in a way that makes it easy to grab key statistics.

For example, on Facebook alone there are 2.7 billion (yes, billion) likes each day...


Via Lauren Moss, Ivo Nový, Alessandro Rea
Laura Tate's curator insight, July 10, 2013 8:25 PM

This is why it is crucial for every business to have a presence on the Web, and a strong social media marketing strategy. Take a look at some of the mind-boggling numbers on this chart.

Michelle Gilstrap's curator insight, July 14, 2013 12:59 PM

Very interesting stats regarding social media. Business Owners who are not using social media, need to get into the action

Maria Richards's curator insight, April 8, 2014 7:56 AM

Wow! Staggering statistics. 

Rescooped by michel verstrepen from 21st Century Learning and Teaching
Scoop.it!

Where In the World Is the Internet? [Infographic]

Where In the World Is the Internet? [Infographic] | information analyst | Scoop.it
The Internet has become a major part of most people’s days and nights. It’s often the thing people check first thing in the morning, and the thing people do last with their smartphones before bedtime.

Via Gust MEES
Gust MEES's curator insight, July 6, 2013 7:05 AM


Learn more:


http://www.scoop.it/t/21st-century-learning-and-teaching?tag=Infographic


Michelle Gilstrap's curator insight, July 8, 2013 9:55 AM

Very good perspective on the use of the Internet around the world. What is the use in other countries? Now you can see quickly. If you are planning a business venture, it is wise to know the use.

Helena Capela's curator insight, July 8, 2013 1:54 PM

Interesting. Vatican City is very well positioned

Rescooped by michel verstrepen from Eclectic Technology
Scoop.it!

Developing 21st Century Critical Thinkers | Teaching Strategies | Mentoring Minds

Developing 21st Century Critical Thinkers | Teaching Strategies | Mentoring Minds | information analyst | Scoop.it

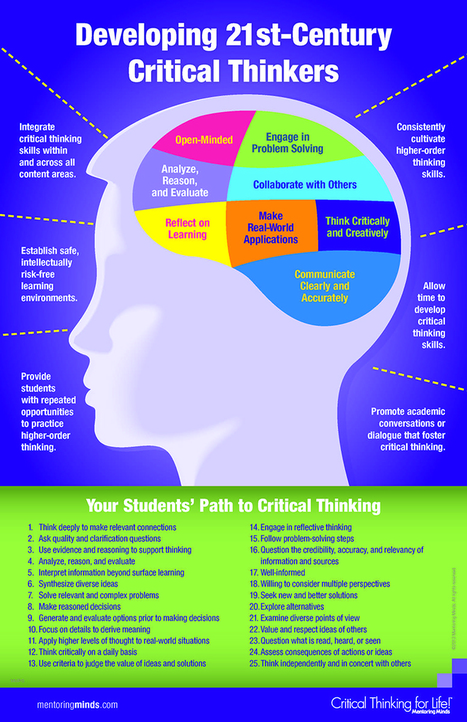
"As we venture into the 21st century, we as a society, are faced with more innovation and challenge than ever before. We now live in an interconnected world, where the Internet and global communications are simultaneously uniting and isolating us as a society. How do we raise critical thinkers to best face the challenges that face our modern society?"


Via Beth Dichter
Beth Dichter's curator insight, June 4, 2013 10:43 PM

This infographic provides a look at how we may develop 21st century critical thinkers. Using an image of a brain with eight areas that look at skills we need to know how to use,and that correspond with 21st century skills found in the Common Core and the Partnership for 21st Century Skills.

In addition there are six that we as teachers should be doing within our classrooms including:

* Integrate critical thinking skills within and across all content areas

* Establish safe, intellectually risk-free learning environments

* Allow time to develop critical thinking skills.

There is also a section called "Your Students' Path to Critical Thinking" that includes 25 recommendations.

The infographic is also available as a pdf file that you may download in an 11" x 17" version at the website.

Undwear Entrepreneur's curator insight, November 12, 2013 5:06 PM

Adapt, improve your knowledge & skill sets, or become obsolete!