


 Your new post is loading...

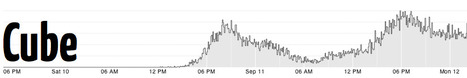

Cube is an open-source system for visualizing time series data, built on MongoDB, Node and D3.
If you send Cube timestamped events (with optional structured data), you can easily build realtime visualizations of aggregate metrics for internal dashboards. (Cube has a handful of chart types that you can assemble into dashboards.)
For example, you might use Cube to monitor traffic to your website, counting the number of requests in 5-minute intervals.
Video demo (60"): http://www.youtube.com/watch?feature=player_embedded&v=oq0qEu1dDdA
Documentation: https://github.com/square/cube/wiki
Source code: https://github.com/square/cube
Find out more: http://square.github.com/cube/
Via Robin Good


