


 Your new post is loading...

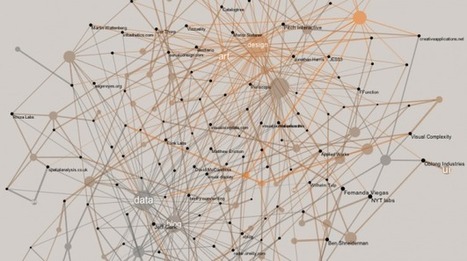

Developer Santiago Ortiz explores visualization references through Delicious tags and puts them in a discovery context. There are two views. The first is a network with tags and resources as nodes. At first it looks like a giant hairball, but mouseover and you get a fisheye effect to zoom in on nodes, which makes them more readable. Mouse over a tag, and the labels for related resources get bigger, and likewise, mouse over a resource, and the related tags get bigger.
The second view lets you compare resources. In the network, select two ore more resources, and then click on the bottom button to compare the selected.
Via Lauren Moss


