Beth Kanter
http://www.bethkanter.org
Another way to articulate the importance of sense-making.
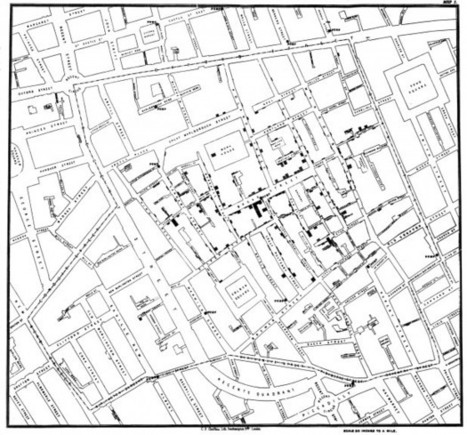
Think about it this way: Tools are not always actual objects designed to help us with physical activities. A notebook, whether it is a Moleskine or an Evernote digital document, is a tool that expands our memory. A digital calculator, whether it is an inexpensive machine bought in the nearest Dollar Tree or an app downloaded to your iPhone, frees you from the burden of having to retain and execute many complex mathematical algorithms. Non-physical tools (or sets of tools and practices), such as statistics and the scientific method, evolved to let us gaze beyond what we would normally see, and to overcome our deepest biases and lazy habits of mind. The same is true for great visual displays of information...
Via
Lauren Moss


 Your new post is loading...

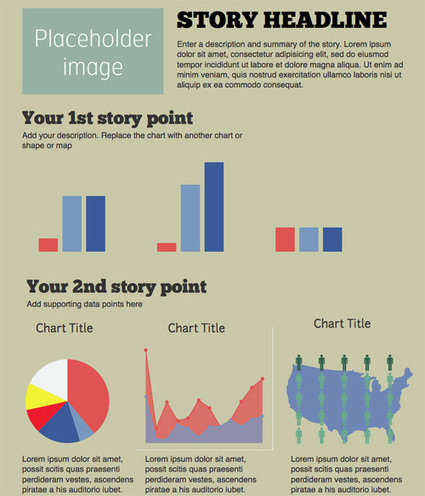


Piktochart is easy to work with and creates a fair Infographic. I still prefer to hire an art director. It's worth the money to have an intelligent designer with you :-)
Don't forget to add your perspecitve, your insight as to why this infographic add up to more than just numbers and figures on a chart.
Another great link to help create infographics. I'd like to get more time to create these for class...