Information and digital literacy in education via the digital path
77.9K views | +1 today
Information and digital literacy in education via the digital path
Literacy in a digital education world and peripheral issues.
Your new post is loading...

Popular Tags

Current selected tag: 'infographic tips'. Clear
Scooped by Elizabeth E Charles
Scoop.it!

Leverage Infographics in Online Training in these Exciting Ways

Leverage Infographics in Online Training in these Exciting Ways | Information and digital literacy in education via the digital path | Scoop.it

According to an article by Forbes, content with images tends to get 94% more views compared to content without images. This is one reason infographics steal the show in any platform. Be it in newspapers or social media, infographics can be found everywhere, even in online learning.

No comment yet.
Rescooped by Elizabeth E Charles from Educational Technology News
Scoop.it!

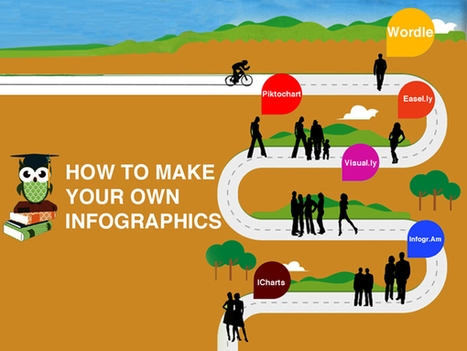
Make Your Own Infographics With The Help of Ten Tools

Make Your Own Infographics With The Help of Ten Tools | Information and digital literacy in education via the digital path | Scoop.it
One hears this all the time:  a picture is worth a thousand words.  That is quite understandable as visual information transmits itself more quickly than v

Via EDTECH@UTRGV
No comment yet.
Rescooped by Elizabeth E Charles from Personalized Professional Development
Scoop.it!

Add Interactive Infogram Charts to PowerPoint Online in 5 Easy Steps

Add Interactive Infogram Charts to PowerPoint Online in 5 Easy Steps | Information and digital literacy in education via the digital path | Scoop.it
Adding data to PowerPoint isn’t as easy as it sounds. Let’s go over how to add interactive Infogram charts to PowerPoint Online in 5 easy steps:
Via Baiba Svenca, Miloš BajÄŤetić, WebTeachers, Mark E. Deschaine, PhD
Baiba Svenca's curator insight, July 29, 2016 10:21 AM

PowerPoint + Infogram + OneDrive

Louise Robinson-Lay's curator insight, July 30, 2016 4:38 AM
Adding data to PowerPoint. Guides.
Suggested by April Alen Abion
Scoop.it!

12 Warning Signs That Your Infographic Sucks

12 Warning Signs That Your Infographic Sucks | Information and digital literacy in education via the digital path | Scoop.it
A list of warning signs that indicate your infographic is poorly structured, badly designed or doesn't communicate effectively.
No comment yet.
Rescooped by Elizabeth E Charles from Daily Magazine
Scoop.it!

How to Make an Infographic and Avoid Common Mistakes

How to Make an Infographic and Avoid Common Mistakes | Information and digital literacy in education via the digital path | Scoop.it
11 steps on how to make an Infographic and avoid common mistakes. See why Infographics are such a powerful marketing, SEO and traffic magnet if done right.

Via THE OFFICIAL ANDREASCY
No comment yet.
Scooped by Elizabeth E Charles
Scoop.it!

Infographics Science: The Surprising Way The Brain Processes Visuals

Infographics Science: The Surprising Way The Brain Processes Visuals | Information and digital literacy in education via the digital path | Scoop.it
Based on how the brain deciphers complex visual information, designers can understand the scientific basis behind best the practices for infographics.
No comment yet.
Scooped by Elizabeth E Charles
Scoop.it!

Adioma - Knowledge Visualization Tool

Adioma - Knowledge Visualization Tool | Information and digital literacy in education via the digital path | Scoop.it
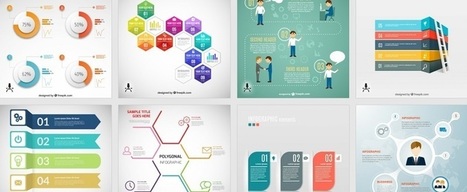
Get infographic presentation slides for PowerPoint, Keynote and Google Slides designed by Adioma team. Fully editable and customizable. Make your next presentation in minutes.
No comment yet.
Scooped by Elizabeth E Charles
Scoop.it!

Introduction to Data Visualization

Introduction to Data Visualization | Information and digital literacy in education via the digital path | Scoop.it
Making data visualisations: a survival guide. Let's focus Export. Milestones in the History of Thematic Cartography, Statistical Graphics, and Data. Related
No comment yet.
Scooped by Elizabeth E Charles
Scoop.it!

The 7 Top Benefits Of Using Infographics In Online Training - eLearning Industry

The 7 Top Benefits Of Using Infographics In Online Training - eLearning Industry | Information and digital literacy in education via the digital path | Scoop.it
Wondering which are the benefits of using infographics In Online Training? Read this article to discover why to use Infographics In Online Training.
No comment yet.
Scooped by Elizabeth E Charles
Scoop.it!

6 Tips for Creating Top-Notch Infographics For Teaching and Learning — Emerging Education Technologies

6 Tips for Creating Top-Notch Infographics For Teaching and Learning — Emerging Education Technologies | Information and digital literacy in education via the digital path | Scoop.it
These Suggestions Will Help You Make Awesome Images That Really Help Students Learn Have you ever used infographics with your students? Chances are you have without even realizing it. Infographics are simply visuals used to represent information or data. We
No comment yet.
Rescooped by Elizabeth E Charles from Learning & Technology News
Scoop.it!

9 Generic activities for exploiting infographics

9 Generic activities for exploiting infographics | Information and digital literacy in education via the digital path | Scoop.it

Infographics are a great source of information and make reading information from the computer screen much easier, but just showing students an infographic and telling them to study it isn’t the most effective way to exploit the medium.


Via Nik Peachey
Elizabeth E Charles's insight:

A Nik Peachey blog on exploiting infographics - examples of how to use them as a teaching tool.

Nik Peachey's curator insight, January 16, 2016 3:02 AM

My blog post with tasks for exploiting infographics to develop digital literacy and critical thinking skills.

Fatiha CHAHI 's curator insight, January 17, 2016 5:35 AM

Comment exploiter les infographies en classe ? Des idées sur le blog de Nick Peachey.

elearning at eCampus ULg's curator insight, January 18, 2016 9:33 AM

Excellent ideas to be shared by everyone ;-)


Rescooped by Elizabeth E Charles from Education and Tech Tools
Scoop.it!

17 Fantastic Infographic Generators!

Data is crucial. However, displaying a chunk of plain data can be monotonous. Infographics visualize plain data and make it visually more appealing. Data turned into infographic has a higher potential to go viral and be effective. While many of us are designers who can design amazing infographs, Infographic Generators can come in handy to Designers and non-designers alike. They can be a time saving resource. So here is a list of 17 fantastic Infographic Generators I compiled together:...


Via Jeff Domansky, Becky Roehrs
Willem Kuypers's curator insight, March 9, 2015 2:37 AM

J'utilise de plus en plus les info-graphiques. Ce site aide à les créer pour ceux qui sont moins doués en graphisme.

Fran Bozarth's curator insight, March 11, 2015 2:31 PM

This could spice up just about any presentation - student or instructor. 

Monica S Mcfeeters's curator insight, March 20, 2015 11:49 PM

Here are links for to help with creating info-graphs.