Information and digital literacy in education via the digital path
77.9K views | +0 today
Follow
Information and digital literacy in education via the digital path
Literacy in a digital education world and peripheral issues.
Your new post is loading...

Popular Tags

Current selected tag: 'visualisation tools'. Clear
Rescooped by Elizabeth E Charles from Big Data + Libraries
Scoop.it!

21 Essential Data Visualization Tools – UsabilityTools.com Blog

21 Essential Data Visualization Tools – UsabilityTools.com Blog | Information and digital literacy in education via the digital path | Scoop.it
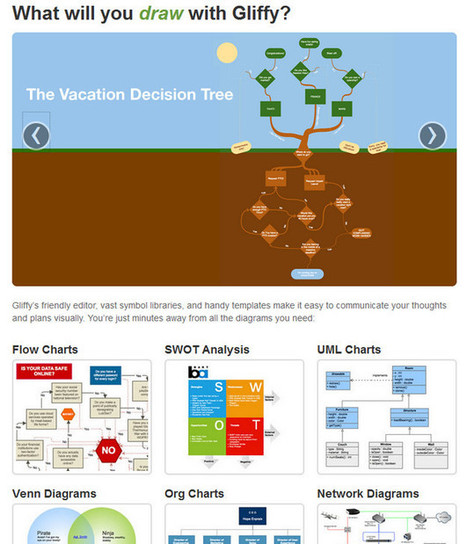
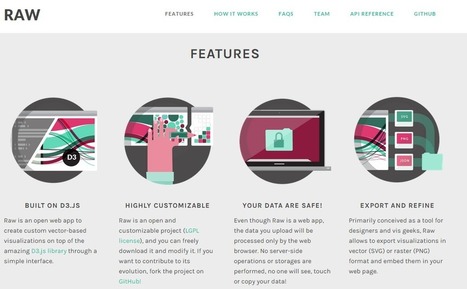
If you are a data lover, then you must check the 21 data visualization tools we curated for you. Most of them are free and easy to use.
No comment yet.
Rescooped by Elizabeth E Charles from Big Data + Libraries
Scoop.it!

Visualizations: Comparing Tableau, SPSS, R, Excel, Matlab, JS, Python, SAS

Visualizations: Comparing Tableau, SPSS, R, Excel, Matlab, JS, Python, SAS | Information and digital literacy in education via the digital path | Scoop.it
Here we ask you to identify which tool was used to produce the following 18 charts: 4 were done with R, 3 with SPSS, 5 with Excel, 2 with Tableau, 1 with Matla…
No comment yet.
Scooped by Elizabeth E Charles
Scoop.it!

Which chart or graph is right for you? | Tableau Software

Which chart or graph is right for you? | Tableau Software | Information and digital literacy in education via the digital path | Scoop.it
No comment yet.
Scooped by Elizabeth E Charles
Scoop.it!

17 visualisation tools to make your data beautiful

17 visualisation tools to make your data beautiful | Information and digital literacy in education via the digital path | Scoop.it
You don’t need to be a seasoned data scientist or have a degree in graphic design in order to create incredible data visualisations.
Ann Ewel's curator insight, March 4, 2015 6:17 PM

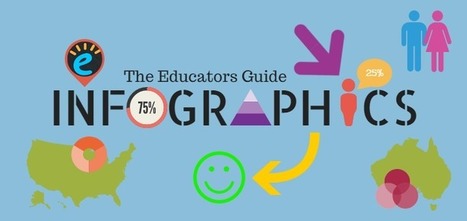
Great list of tools for inforgraphics, can't wait to try them.

Scooped by Elizabeth E Charles
Scoop.it!

A Great Resource for Downloading Ready-made Charts and Diagrams to Use in Class ~ Educational Technology and Mobile Learning

A Great Resource for Downloading Ready-made Charts and Diagrams to Use in Class ~ Educational Technology and Mobile Learning | Information and digital literacy in education via the digital path | Scoop.it

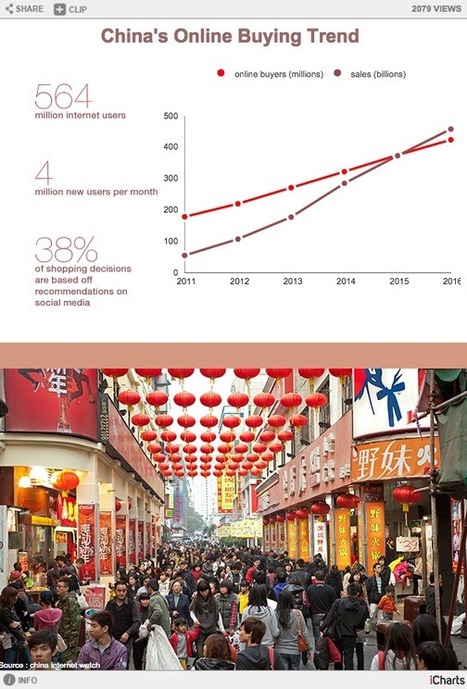
Visualizing data is sometimes the best way to effectively communicate your message especially when it comes to complex data that requires a lot of explanation.

No comment yet.
Rescooped by Elizabeth E Charles from Big Data + Libraries
Scoop.it!

Visualizations: Comparing Tableau, SPSS, R, Excel, Matlab, JS, Python, SAS

Visualizations: Comparing Tableau, SPSS, R, Excel, Matlab, JS, Python, SAS | Information and digital literacy in education via the digital path | Scoop.it
Here we ask you to identify which tool was used to produce the following 18 charts: 4 were done with R, 3 with SPSS, 5 with Excel, 2 with Tableau, 1 with Matla…
No comment yet.
Scooped by Elizabeth E Charles
Scoop.it!

The Educators' Guide to Infographics

The Educators' Guide to Infographics | Information and digital literacy in education via the digital path | Scoop.it
Sometimes when you're compiling your content for your next blog post you find that, to get your point across, you have to cover a lot of facts and figures, statistics, or tabular information, and i...
No comment yet.
Rescooped by Elizabeth E Charles from Digital Literacies information sources
Scoop.it!

Visualisation tools for all tastes

Visualisation tools for all tastes | Information and digital literacy in education via the digital path | Scoop.it

Description


Via Fiona Harvey
Fiona Harvey's curator insight, February 22, 2015 5:01 AM
Collection of tools for all tastes and needs