Create, Innovate & Evaluate in Higher Education
29.4K views | +0 today
Follow
Create, Innovate & Evaluate in Higher Education
All about Educational Innovation, new tools & trends, MOOCs in Higher Education
Curated by Alfredo Corell
Your new post is loading...
Rescooped by Alfredo Corell from Public Relations & Social Marketing Insight
Scoop.it!

17 Fantastic Infographic Generators!

17 Fantastic Infographic Generators! | Create, Innovate & Evaluate in Higher Education | Scoop.it

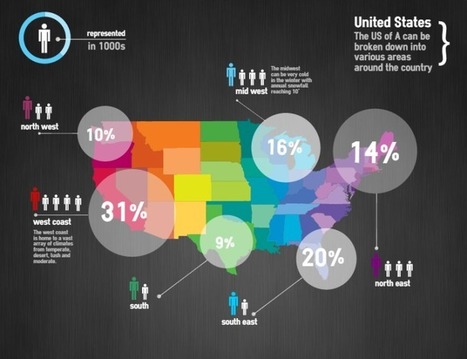
Data is crucial. However, displaying a chunk of plain data can be monotonous. Infographics visualize plain data and make it visually more appealing. Data turned into infographic has a higher potential to go viral and be effective. While many of us are designers who can design amazing infographs, Infographic Generators can come in handy to Designers and non-designers alike. They can be a time saving resource. So here is a list of 17 fantastic Infographic Generators I compiled together:...


Via Jeff Domansky
Alfredo Corell's insight:
  1. Canva: https://www.canva.com/ 
  2. Vizualize.me: http://vizualize.me/ 
  3. Easelly: http://www.easel.ly/ 
  4. Piktochart: http://piktochart.com/ 
  5. infogr.am: https://infogr.am/ 
  6. Venngage: https://venngage.com/ 
  7. Visme: http://www.visme.co/#Infographics 
  8. iCharts: http://icharts.net/ 
  9. Sprites: https://spritesapp.com/ 
  10. Infoactive: https://infoactive.co/ 
  11. Kinzaa: http://kinzaa.com/ 
  12. tableau public: http://www.tableau.com/public/ 
  13. Wordle: http://www.wordle.net/ 
  14. Good labs: http://labs.good.is/ 
  15. Weave: http://www.oicweave.org/index.php
  16. Biogrify: http://www.biogrify.com/
  17. re.vu: http://re.vu/ 
Willem Kuypers's curator insight, March 9, 2015 2:37 AM

J'utilise de plus en plus les info-graphiques. Ce site aide à les créer pour ceux qui sont moins doués en graphisme.

Fran Bozarth's curator insight, March 11, 2015 2:31 PM

This could spice up just about any presentation - student or instructor. 

Monica S Mcfeeters's curator insight, March 20, 2015 11:49 PM

Here are links for to help with creating info-graphs.

Rescooped by Alfredo Corell from Digital Delights for Learners
Scoop.it!

Infoactive - Create and share interactive, visual stories

Infoactive - Create and share interactive, visual stories | Create, Innovate & Evaluate in Higher Education | Scoop.it
InfoActive lets you create and share interactive, visual stories.

Via Ana Cristina Pratas
Alfredo Corell's insight:

You don't need to be a programmer, a designer, or a data analyst. Heck, you don't even need a tutorial. Drag and drop, rock and roll.


Build a story

Combine text, charts and interactive filters into living narratives. Let your readers deep dive into the parts of the dataset that mean the most to them.


Taryn Coxall's curator insight, October 15, 2013 8:17 PM

"Infoactive" is a simple and interactive resource, suitable for both teachers and the upper primary student. 

this enagaging website allows users to  create andmost importantly share viual stories. It allows the audience/ the reader to explore their ideas through a collaboration of images, videos, audio and text.

perfect for the modern day classroom teacher, this website is sure to engage students by placing a fun, interesting and interactive vibe on a average lesson in the classroom. 


María Dolores Díaz Noguera's curator insight, November 16, 2013 8:08 AM
Amazing
Henry Cortez's curator insight, March 23, 2014 11:55 AM

Henry Cortez