

Sesión 2: utilización de los medios sociales en la docencia universitaria @alfredovela @virtualf7_0

|
Scooped by Alfredo Corell |

No comment yet.
Sign up to comment
Get Started for FREE
Sign up with Facebook Sign up with X
I don't have a Facebook or a X account


 Your new post is loading...
 Your new post is loading...
Your new post is loading...
Sesión 2: utilización de los medios sociales en la docencia universitaria @alfredovela @virtualf7_0
No comment yet.
Sign up to comment
Alfredo Corell's insight:
A completely updated web app to create stunning infographics in few minutes!!! It deserves a visit. Thus, Have a go Of course... there's a "pro" option

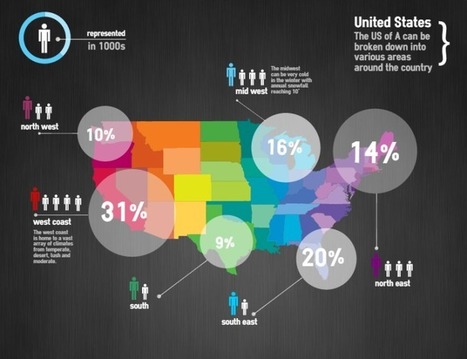
Las visualizaciones gráficas son herramientas poderosas para mostrar conceptos e ideas. Son útiles para atrapar a los usuarios en un gráfico con la información que compilamos para elaborarla. La mayoría de ellas está pensada para transmitir contenido relevante. Via Cacho Mazzoni
Alfredo Corell's insight:
1-Piktochart
2-Visual.ly
3-Fluxvfx
4-Many Eyes
5-Vizualize.me
6-Infogr.am
7-Vizify
8-Photo Stats
9-Creately
10-Stat Planet
11-Hohli
12-Google Public Data Explorer
13-Tagxedo
14-Wordle
15-Cacoo
|
Data is crucial. However, displaying a chunk of plain data can be monotonous. Infographics visualize plain data and make it visually more appealing. Data turned into infographic has a higher potential to go viral and be effective. While many of us are designers who can design amazing infographs, Infographic Generators can come in handy to Designers and non-designers alike. They can be a time saving resource. So here is a list of 17 fantastic Infographic Generators I compiled together:... Via Jeff Domansky
Alfredo Corell's insight:

Willem Kuypers's curator insight,
March 9, 2015 2:37 AM
J'utilise de plus en plus les info-graphiques. Ce site aide à les créer pour ceux qui sont moins doués en graphisme. 
Fran Bozarth's curator insight,
March 11, 2015 2:31 PM
This could spice up just about any presentation - student or instructor. 
Monica S Mcfeeters's curator insight,
March 20, 2015 11:49 PM
Here are links for to help with creating info-graphs.
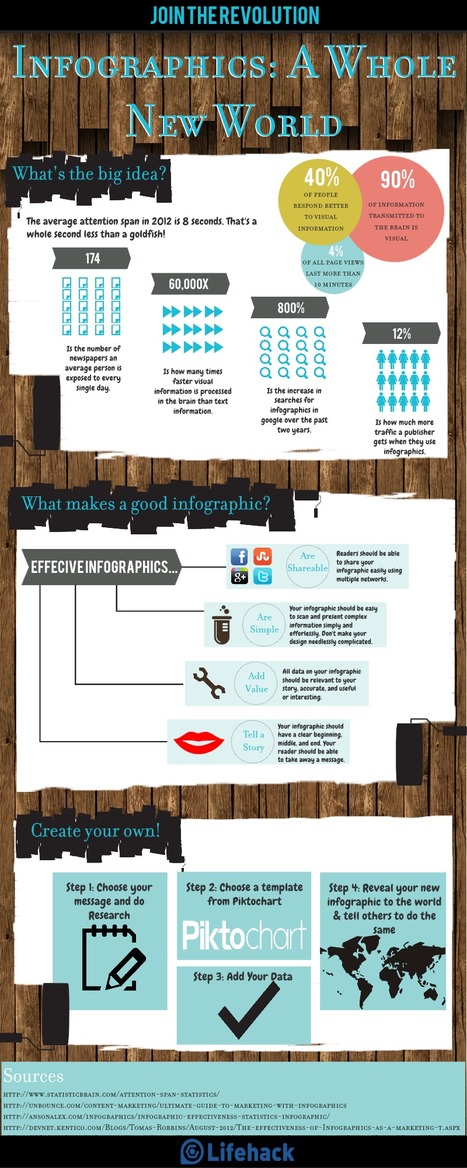
Learn how to create stunning infographics - without spending hundreds of dollars on a graphic designer or losing your mind - in just 30 minutes or less.
The Piktochart site (free): http://piktochart.com/
Via Baiba Svenca

Jeff Domansky's curator insight,
January 7, 2013 4:29 PM
Really excellent how-to using the impressive Piktochart infographic tool. 
Neil Ferree's curator insight,
February 26, 2013 10:05 AM
Infographics done right and done well can generate lots of traffic to your http://bit.ly/RichSnippet and build your brand


Piktochart's comment,
September 26, 2013 2:21 AM
Hi! We have updated our website and editor - please check it out and tell us what you think!
http://magic.piktochart.com/ |


Presentación de la Segunda sesión del curso Medios Sociales en Formación. Se utilizaron herramientas como: