


You don’t need to be a seasoned data scientist or have a degree in graphic design in order to create incredible data visualisations.
Via Baiba Svenca
Get Started for FREE
Sign up with Facebook Sign up with X
I don't have a Facebook or a X account


 Your new post is loading...
 Your new post is loading...
Your new post is loading...
You don’t need to be a seasoned data scientist or have a degree in graphic design in order to create incredible data visualisations. Via Baiba Svenca
Alfredo Corell's insight:
A super list of tools for creating digital content (infographics, word clouds, conceptual maps, chartas, etc...) for your Digital presentations. 
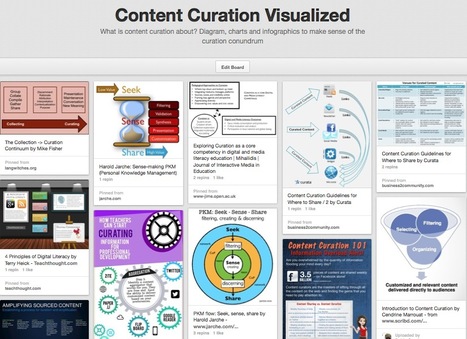
What is content curation about? Diagram, charts and infographics to make sense of the curation conundrum Via Robin Good
Alfredo Corell's insight:
a Pinterest board with all images about Content curation by one of the best and more active curators

Monica S Mcfeeters's curator insight,
March 30, 2014 9:18 AM
This will be helpful to share to those wondering about content curation. 
Jeff Domansky's curator insight,
September 1, 2014 11:53 PM
Valuable collection of the art of curation from Robin Good.
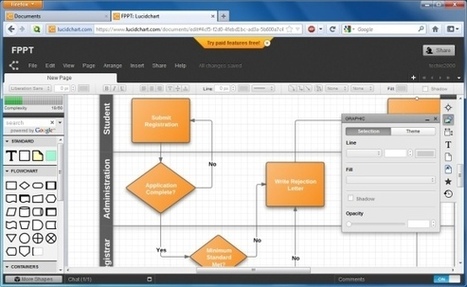
Lucid Chart is an online platform for creating powerful diagrams and flowcharts that can be used for creating presentations and for visual communication with your audience. Via Baiba Svenca
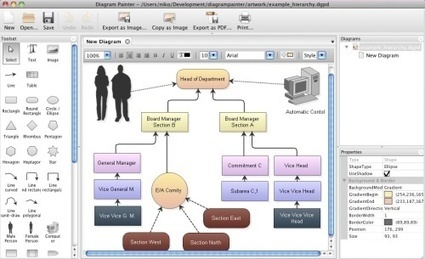
With DiagramPainter, you can quickly draw flowchart diagrams, mind mappings, organization charts, and more. With a few clicks, you can then integrate the diagram in your favourite program, by copying it to the clipboard as image, or saving it as file... Free trial. Via Baiba Svenca

Kshitija's curator insight,
December 22, 2012 6:21 AM
A useful tool for all business executives who regularly make complex or data presentations. The tool helps you make flowchart diagrams, mind maps and even organization charts. It can save your diagram in various formats like .jpg or .png You can also try using editable PowerPoint diagrams specially designed for business users. You can use such diagrams as is or edit them to suit your style. Take for example a MindMap and see how it is used to show how to Strike a Balance in Life - http://www.24point0.com/product-reviews-and-applications/easy-to-download-edit-%E2%80%93-mind-map-diagram-for-ppt-presentations/
Diagramly is a capable online diagramming tool, it’s free and can produce fairly complex diagrams and charts... Via Baiba Svenca

Human Interest Agency- Child Support Enforcement's curator insight,
September 6, 2016 8:09 PM
HIATX.com
|
"Through the Free Technology for Teachers Facebook page I recently received a request for some suggested online chart creation tools..." Via Baiba Svenca
Alfredo Corell's insight:
Again Richard Byrne has compiled tools for creativity and designing diagrams and charts. Have a look!!!

Gust MEES's curator insight,
February 11, 2015 11:13 AM
Lucidchart is an easy tool to use to create flowcharts, mindmaps, and graphic organizers. Lucidchart offers a simple drag and drop interface for creating flow charts, organizational charts, mind maps, and other types of diagrams. To create with Lucidchart just select elements from the menus and drag them to the canvas. You can re-size any element and type text within elements on your chart. Arrows and connecting lines can be re-sized, repositioned, and labeled to bring clarity to your diagrams. Find out more tools by visiting the article...

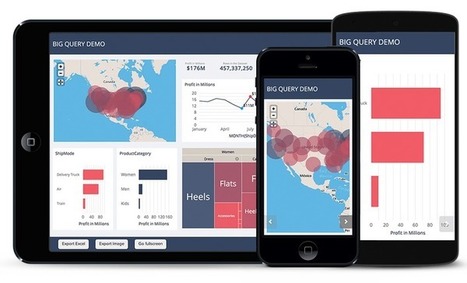
iCharts accelerates data storytelling with simplistic, interactive, visualization tools for big and small data providers. Via Baiba Svenca
Alfredo Corell's insight:
simple, interactive, good...

Christine Bushong's curator insight,
March 5, 2013 8:30 AM
This might be a good tech tool for math or science classes. 
Sue Gould's curator insight,
March 6, 2013 6:34 PM
There is an emerging learning trend towards visual stimulus as a result of growing up with videos, TV, and technology from barbie laptops to Ipads. This is a great resource for tutors to reach this audience while using few words. 
Robert Sims's curator insight,
March 15, 2013 5:07 PM
Here's a great tool for building up the Taxonomy usage in your classroom!

Gliffy.com is a web-based diagram editor. Create and share flowcharts, network diagrams, floor plans, user interface designs and other drawings online. Via Baiba Svenca
It's FREE and Open Source (GPL). Via Baiba Svenca
|


Ca donne envie d'essayer : nuage de mots, graphiques, cartes... Par Christopher Ratcliff @ Econsultancy publié le 25/02
Check out how to add visualisations to your presentations.
197