

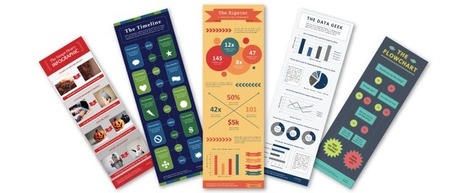

Learn how to easily create professional-looking infographics in PowerPoint with these 10 free templates.
Via Baiba Svenca
Get Started for FREE
Sign up with Facebook Sign up with X
I don't have a Facebook or a X account


 Your new post is loading...
 Your new post is loading...
Your new post is loading...
Learn how to easily create professional-looking infographics in PowerPoint with these 10 free templates. Via Baiba Svenca
Alfredo Corell's insight:
If you prepare infographics in PowerPoint, here you have some useful tips (and some free templates) 
Conveying information in a striking, concise way has never been more important, and infographics are the perfect pedagogical tool with which to do so. Below, you’ll find my experience with designing an infographic-friendly classroom research project, explained in a step-by-step process you can implement in your own classroom. Via Nik Peachey
Alfredo Corell's insight:
For this process, I recommend NeoMam Studio’s “13 Reasons Why Your Brain Craves Infographics,” which describes their efficacy in a visually compelling way...

Bibhya Sharma's curator insight,
November 23, 2014 8:30 PM
I believe this new strategy will work. It will surely engage our students and promote group work. We can also assess on creativity. 
The Rice Process's curator insight,
November 24, 2014 8:22 AM
infographics present the greatest opportunity to increase the effectiveness of what is being taught. Designing visual representation of information is more than translating words to pictorials. The construction involves filtering the information, drawing relationships, revealing patterns and representing the information as meaningful content.

After many requests for a drawing feature, we’re happy to announce that Mural.ly now allows you to sketch your ideas out on sticky notes (and we’re pretty excited about it). Via Baiba Svenca
Alfredo Corell's insight:
Mural.ly has novel tools. Among other, you can add sticky notes inside. Have a go for your infographics

Rosemary Tyrrell, Ed.D.'s curator insight,
July 8, 2014 12:27 PM
Presentation tool with a new feature. 
Raquel Oliveira's curator insight,
July 8, 2014 6:20 PM
infografico do caminho de desenho de serviços que vale como refererencia.
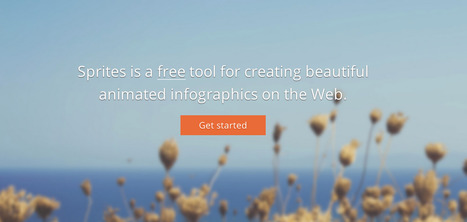
Sprites is a free tool for creating beautiful animated infographics for the Web. Via Ana Cristina Pratas
Alfredo Corell's insight:
Easy to Use With a good set of visual elements and built-in themes composing your infographic becomes super-easy. Free and Open The basic version of Sprites is absolutely free for everybody and all infographics are released under Creative Commons license. Embracing the Web Everything in Sprites is 100% HTML5-based and plugin-free. There's no Flash or any other proprietary technology used. Fully Scalable Sprites infographics utilize the newest responsive design techniques and should look good on pretty much any device. Mobile-Ready We try to make Sprites infographics shine on as many platforms as possible. You can already try it on your iPhone and iPad. Developer-Friendly The JavaScript SDK plus the guidelines on making your own themes are available atgithub.com/spritesapp.

Raluca Luana Gaiseanu's curator insight,
May 28, 2014 3:47 AM
Keep searching for a good free infographic tool, that will make my "life" easier. Today, Sprites is tested :) Brand new app, so let's criticize. :D

Easily Create online Presentations, animations, animated HTML5 banners, infographics and other rich visual content free in your browser. Visme is the perfect alternative to Flash and Powerpoint or keynote to create professional presentations, infographics, HTML5 banners and interactive content in HTML5. Via Baiba Svenca
Alfredo Corell's insight:
A Nice tool to create infographics, animations, presentations, etc.. web based (called EWC presenter before)

malek's curator insight,
April 6, 2014 7:53 AM
Want to liven up your resume? Give VisMe a trial, it's free 
Monica S Mcfeeters's curator insight,
April 6, 2014 6:13 PM
This is a great presentation tool for any browser! 
Darleana McHenry's curator insight,
April 12, 2014 10:17 AM
This is an interesting site that I want to try.
Vivimos en un mundo donde la información rápida y gratuita se encuentra a sólo unos clics de distancia. Aunque esto parece ser algo bueno, el problema aparece cuando se quiere interpretar la gran cantidad de datos disponibles a nuestro alrededor.
Alfredo Corell's insight:
hay 7 consejos clave para crear sus propias infografías: 1. Haga un plan2. Agregue valor primero; estética después3. Cuente una historia4. Sea un gran diseñador … O busque uno. 5. Use la teoría del color6. Pida una opinión7. Hágala fácil de compartir
Alfredo Corell's insight:
A completely updated web app to create stunning infographics in few minutes!!! It deserves a visit. Thus, Have a go Of course... there's a "pro" option

Two Pens's curator insight,
May 13, 2013 1:14 PM
Piktochart is easy to work with and creates a fair Infographic. I still prefer to hire an art director. It's worth the money to have an intelligent designer with you :-) 
Eddie Thornton's curator insight,
May 13, 2013 3:29 PM
Don't forget to add your perspecitve, your insight as to why this infographic add up to more than just numbers and figures on a chart. 
Ness Crouch's curator insight,
May 14, 2013 4:09 PM
Another great link to help create infographics. I'd like to get more time to create these for class...
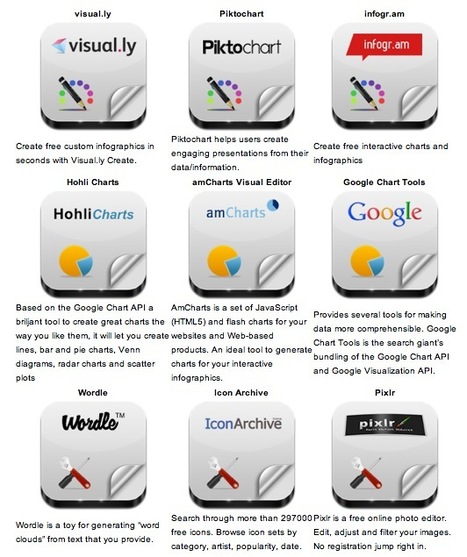
Robin Good: Here is a handy short guide to nine free infographic creation tools that can be utilized to create enticing visuals, word charts and data-based infographics without having special technical skills.
Useful. 8/10
Check them all out: http://www.infographicsarchive.com/create-infographics-and-data-visualization/ ;
(Unearted by Andres Taborga) Via Robin Good
Alfredo Corell's insight:
free infographic creation tools to use without too much effort

Sahana Chattopadhyay's curator insight,
May 4, 2015 11:59 PM
Infographics are great tools to present curated and focused content from a specific perspective. |
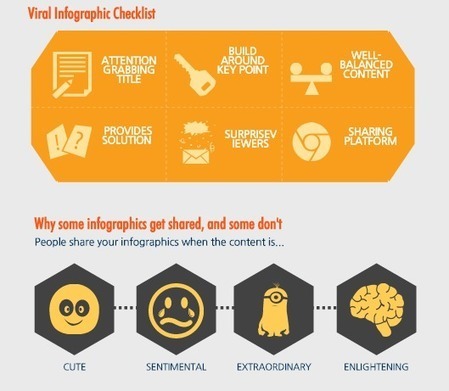
Sharing your infographic online is no different. There are hundreds of thousand of infographics out there. In fact, if you search the term “infographics” in Google over 43 million search results populate. Everything from the latest blog post about infographics (like this one) to different tools and programs you can use to create an infographic appear in search results.So, how do you get your infographic to not only show up, but be shared across networks? Follow the below five steps, do even more research than necessary, and begin your road to virality.... Via Jeff Domansky
Today I'm sharing just why it's dangerous to put your trust in copy on it's own and why visual content can create the perfect balance for your blog. Via Baiba Svenca
Alfredo Corell's insight:
A short list of tools for creating visual content. All of them are good, but are much more than these 15.

Deb Nystrom, REVELN's curator insight,
September 5, 2014 9:11 PM
Writing without the power of visuals is flat and boring. These tools bring your ideas to life. Stacey's made some very useful annotations about what is useful about each of the 15 tools. Great list! ~ Deb 
Pam Colburn Harland's curator insight,
September 7, 2014 8:39 AM
Great list of useful graphics tools!
Una presentación sobre Diseño y uso docente de materiales multimedia (1ª parte).
Alfredo Corell's insight:
Presentación de Alfredo Vela para un curso de Formación del Profesorado en la Universidad de Valladolid
Una presentación con 16 herramientas online gratuitas para crear infografías.
Alfredo Corell's insight:
Una selección de herramientas gratuitas online para crear infografías. Algunas tienen opciones de pago para herramientas avanzadas

Infographics are popular. They’re a fun way to present and read data, and many people believe that information that is presented visually is often retained better (at least for some learners).
Alfredo Corell's insight:
Interactive infographics are really cool. They allow users to interact with the data – sometimes in a superficial way such as with mouse over or scrolling effects, or in a more meaningful way, where users can input their own data and the graphic becomes more personalized to their needs. That said, making an interactive infographic is more complicated than making a static infographic, and most people will assume that creating interactive infographics is way above their technological expertise (or at least will require more time than they can devote to it).
Here are five free tools that your students can use to create infographics.
Alfredo Corell's insight:
A recent review by the always direct to the point Richard Byrne. Some of the tools, old in the media... but a nice and useful review.
Thanks to Carole DEBONT for the suggestion
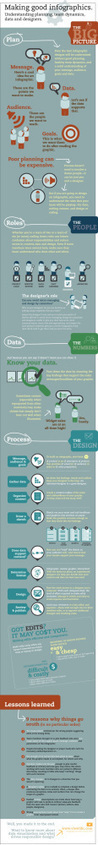
Hola: Una infografía sobre: Haciendo buenas infografías. Un saludo
Alfredo Corell's insight:
Good tips to make and design your own infographics

Las visualizaciones gráficas son herramientas poderosas para mostrar conceptos e ideas. Son útiles para atrapar a los usuarios en un gráfico con la información que compilamos para elaborarla. La mayoría de ellas está pensada para transmitir contenido relevante. Via Cacho Mazzoni
Alfredo Corell's insight:
1-Piktochart
2-Visual.ly
3-Fluxvfx
4-Many Eyes
5-Vizualize.me
6-Infogr.am
7-Vizify
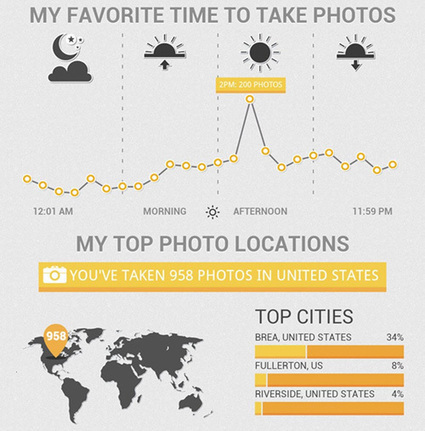
8-Photo Stats
9-Creately
10-Stat Planet
11-Hohli
12-Google Public Data Explorer
13-Tagxedo
14-Wordle
15-Cacoo
|


I love infographics! Thanks to HubSpot for sharing these.
a good visual tool
This is a helpful post for those who would like to make infographics in Powerpoint. You can also download 10 free templates.