


"Through the Free Technology for Teachers Facebook page I recently received a request for some suggested online chart creation tools..."
Via Baiba Svenca
Get Started for FREE
Sign up with Facebook Sign up with X
I don't have a Facebook or a X account


 Your new post is loading...
 Your new post is loading...
Your new post is loading...
"Through the Free Technology for Teachers Facebook page I recently received a request for some suggested online chart creation tools..." Via Baiba Svenca
Alfredo Corell's insight:
Again Richard Byrne has compiled tools for creativity and designing diagrams and charts. Have a look!!! 

iCharts accelerates data storytelling with simplistic, interactive, visualization tools for big and small data providers. Via Baiba Svenca
Alfredo Corell's insight:
simple, interactive, good...

Christine Bushong's curator insight,
March 5, 2013 8:30 AM
This might be a good tech tool for math or science classes. 
Sue Gould's curator insight,
March 6, 2013 6:34 PM
There is an emerging learning trend towards visual stimulus as a result of growing up with videos, TV, and technology from barbie laptops to Ipads. This is a great resource for tutors to reach this audience while using few words. 
Robert Sims's curator insight,
March 15, 2013 5:07 PM
Here's a great tool for building up the Taxonomy usage in your classroom!
|
From
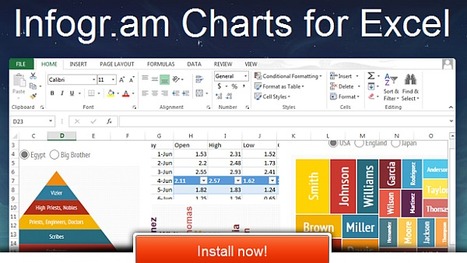
infogr

Create infographics and interactive online charts. It's free and super-easy! Follow other users and discover amazing data stories! Via Baiba Svenca
Alfredo Corell's insight:
Infographics from excell!!! wowowowow

Victor GraphicSave's comment,
August 3, 2013 9:08 AM
Nice Post Visit My Logo Designs http://graphicsave.com/logo-designs
http://graphicsave.com/restaurant-logo
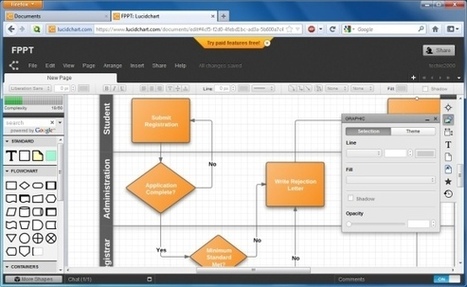
Lucid Chart is an online platform for creating powerful diagrams and flowcharts that can be used for creating presentations and for visual communication with your audience. Via Baiba Svenca
|


Lucidchart is an easy tool to use to create flowcharts, mindmaps, and graphic organizers. Lucidchart offers a simple drag and drop interface for creating flow charts, organizational charts, mind maps, and other types of diagrams. To create with Lucidchart just select elements from the menus and drag them to the canvas. You can re-size any element and type text within elements on your chart. Arrows and connecting lines can be re-sized, repositioned, and labeled to bring clarity to your diagrams.
Find out more tools by visiting the article...
I always struggle with graphics.
#tecnicas