

Hola: Una infografía sobre: Haciendo buenas infografías. Un saludo
Get Started for FREE
Sign up with Facebook Sign up with X
I don't have a Facebook or a X account


 Your new post is loading...
 Your new post is loading...
Your new post is loading...
Hola: Una infografía sobre: Haciendo buenas infografías. Un saludo 
No comment yet.
Sign up to comment
![7 Habits of Highly Effective Teachers Who Use Technology [Infographic] | Create, Innovate & Evaluate in Higher Education | Scoop.it](https://img.scoop.it/qTD-BesGGwk7hSA5XPNRODl72eJkfbmt4t8yenImKBVvK0kTmF0xjctABnaLJIm9)
November 30, 2012 by Angela Maiers
Love this great post from the folks at Always Prepared entitled: ‘The 7 Habits of Highly Effective Teachers Who Use Technology‘ and the infographic it inspired from Mark Bates. Both highlight “The Habitudes” of educators who are effectively using technology to enhance and impact teaching and learning. Hat tip to Shawn McCusker for this awesome Twitter find!
A MUST read: http://www.angelamaiers.com/2012/11/7-habits-of-highly-effective-teachers-who-use-technology.html
Via Gust MEES

AAEEBL's curator insight,
January 21, 2013 7:26 PM
Applicable to all learners, whether students or teachers or carrerists. 
Terri Rice's curator insight,
July 27, 2014 7:08 PM
Absolutely! it is so good to know I have some of the qualities. Working on integrating them all into my daily life.

From
ht

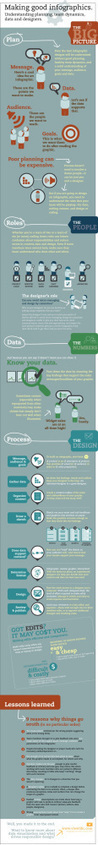
Let’s be honest, we don’t like to read big pieces of text. Text-heavy graphs are rather difficult for understanding, especially when dealing with numbers and statistics. That is why illustrations and flowcharts are often used for such kind of information. An infographic, or a visual representation of study or data, like anything else, can be done right or wrong. How to create a successful infographic? A good idea and a good design.
Stop by the link for more on what defines an infographic, what contributes to its popularity, as well as the various types of infographics and references for tutorials and best practices.
Additional topics covered include: The major parts of an infographic How to create an infographic Developing ideas & organizing data Research & sources Typography, graphics & color Facts & conclusions Designing & Editing Via Lauren Moss, Monique Walhof, THE OFFICIAL ANDREASCY, Jimi Paradise, Alazne González
![The 7-Step Social Media Cheatsheet for Organizations [Infographic] | Create, Innovate & Evaluate in Higher Education | Scoop.it](https://img.scoop.it/0F3gQjyF0blAq1lEZBfV_Tl72eJkfbmt4t8yenImKBVvK0kTmF0xjctABnaLJIm9)
The 7-step cheatsheet below is also available as an infographic PDF or large infographic image courtesy of Signals. Scroll to the bottom of this post to view the infographic version. Get people talking about it at your next strategy session! Via Frédéric DEBAILLEUL, halhol, Martin (Marty) Smith, Rose Marie DeSousa, Maria Margarida Correia
Kathy is the bomb! This site has virtually everything you need to get started including video tutorials.
|
You can create infographics - visual representations of data - from scratch using free web tools. Library consultant and educator Linda W. Braun takes you step by… Via Baiba Svenca
Alfredo Corell's insight:
Very good and detailed tutorial for creating infographics

Baiba Svenca's curator insight,
December 29, 2012 2:43 AM
Great detailed tutorial on how to create infographics using two popular tools - http://www.easel.ly/ and http://infogr.am.

Este año, gracias al Banco Interamericano de Desarrollo, Intel y RELPE, pusimos a disposición del los usuario una colección de videos de Khan Academy. Para aprovechar su uso, les compartimos aquí una infografía interactiva donde podrán encontrar información, videos y links interesantes.
Infographics , also called information graphics, are visual representations of information, data or knowledge. These graphics give visitors a lot of complex information quickly and beautifully in a clear way... Via Baiba Svenca
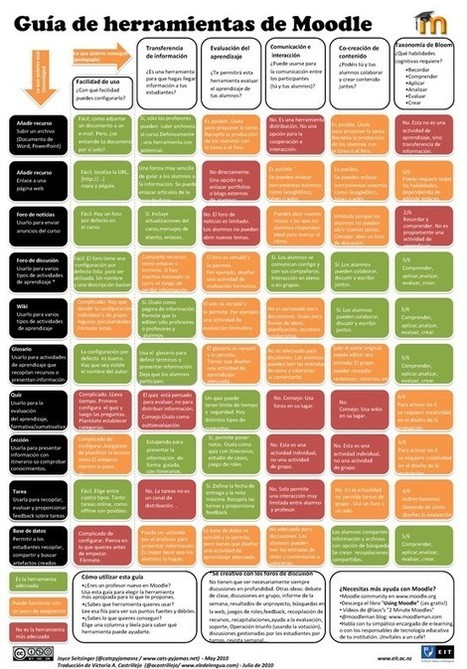
Guía de Herramientas de Moodle (RT @davidrsaez: Guía de Herramientas de #Moodle http://t.co/5hPmY9Gw vía @educlick...)... Via EduClick_España
|


Good tips to make and design your own infographics